0x (ZRX) Retraces Slightly From High; Can the Bulls Regroup and Push the Market Above $1.00 again?

0x Coin has seen a small price decline totalling 1.26% over the past 24 hours of trading. The cryptocurrency is currently exchanging hands at a price around $0.8487 after seeing a significant 22% price increase over the course of the past 30 trading days.
The ERC-20 based cryptocurrency has been designed to help to facilitate decentralised exchanges in their mechanisms. It leverages an off-chain orderbook and therefore requires no trading fees at the same time being able to offer trustless transactions. It is a system that facilitates decentralised trading rather than a decentralised exchange itself.
The cryptocurrency has recently enjoyed the addition of their project to the Coinbase exchange, on of the world’s leading exchanges, seeing a 22% price surge after its addition. However, the addition has come under much scrutiny as infestations have led to the conclusion amongst collusion between 0x and Coinbase. For example, 3 out of 5 advisors for 0x used to be Coinbase employees, leading to many to speculate that some may have benefited from the 0x addition with the additional information before the addition.
0x is currently ranked in 24th position in terms of overall market cap across the entire industry. It currently holds a total market cap value of $463 million after the 14 month old coin suffers a 26% price drop over the past 90 trading days. The token is still trading at a value that is 64% lower than its all time high price.
Let us continue to analyse price action for 0x over the short term and continue to highlight any potential support and resistance zones for 0x.
Price Analysis
ZRX/USD – SHORT TERM – DAILY CHART
https://www.tradingview.com/x/yQz9kb4K/
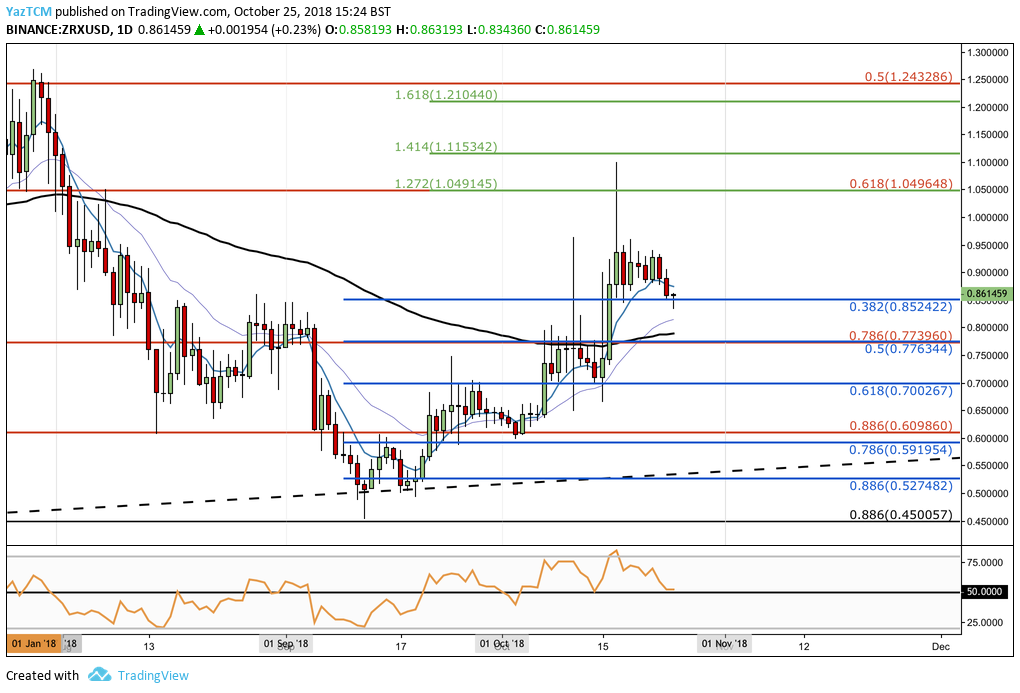
Analysing price action from the short term perspective above, we can see that athe market had reached support at a long term .886 Fibonacci Retracement level (drawn in black) pried at $0.4500. As price action reached this area it reversed and rebounded. It had also found support at a long term upward sloping trend line which helped the market to reverse as well.
The market then surged from a low of $0.4530 on the 12th of September 2018 and extended all the way to a high of $1.0989 on the 17th of October 2018. The price increased totalled 144% from low to high.
We can see that after placing the high, price action has now pulled-back slightly and is now trading at support provided by the short term .382 Fibonacci Retracement level (drawn in blue) priced at $0.8524. This Fibonacci Retracement level is measured from the bullish run outlined above.
Moving forward, if the bears continue to pressure price action lower, we can expect immediate support below to be located at the short term .5 Fibonacci Retracement level (drawn in blue) priced at $0.7763. This area of support is also significantly bolstered by the medium term .786 Fibonacci Retracement (drawn in red) and the 100 day moving average which are both priced in the same area further adding to the expected support at this level.
If the bears continue to push the market further below the support at $0.77 then more support below can be located at the short term .618 Fibonacci Retracement level (drawn in blue) priced at $0.70 followed by the short term .786 Fibonacci Retracement level (drawn in blue) priced at $0.5919.
On the other hand, if the bulls regroup their effort and push price action higher, we can expect immediate resistance above to be located at previous resistance provided by the $0.95 handle. Resistance above this will then be located at the psychological round number handle at $1.00.
IF the bulls can continue to penetrate above $1.00 there will be more resistance above at the 1.272 Fibonacci Extension level (drawn in green) priced at $0.1049. It is important to highlight that this level of resistance is further bolstered by a medium term .618 Fibonacci Retracement level (drawn in red). Further resistance above can then be expected at the 1.414 and 1.618 Fibonacci Extension levels (drawn in green) priced at $1.11 and $1.21 respectively.
The post 0x (ZRX) Retraces Slightly From High; Can the Bulls Regroup and Push the Market Above $1.00 again? appeared first on ZyCrypto.