Bitcoin Realized Cap Sets All-Time High, Price Next?
On-chain data shows the Bitcoin Realized Cap has set a new all-time high (ATH) with the latest rally in the cryptocurrency’s price.
Bitcoin Realized Cap Has Just Achieved A New High
As CryptoQuant founder and CEO Ki Young Ju explained in a post on X, the Bitcoin Realized Cap has set a new record. The “Realized Cap” is an indicator that, in simple terms, tells us about the total amount of investment that the investors have put into the cryptocurrency.
This capitalization model is different from the usual market cap, which calculates the asset’s total valuation by equating each coin’s price in the circulating price to the current spot value.
The Realized Cap instead sets the value of each coin to be the same as the spot price at the time of its last movement. The logic behind this is that the last transfer was probably the last time the coin changed hands, and so the price at its time would be its current cost basis.
Thus, the sum of the cost basis for the entire supply would correspond to an estimate of the capital the holders used to purchase Bitcoin.
Now, here is a chart that shows the trend in the Bitcoin Realized Cap over the past few years:
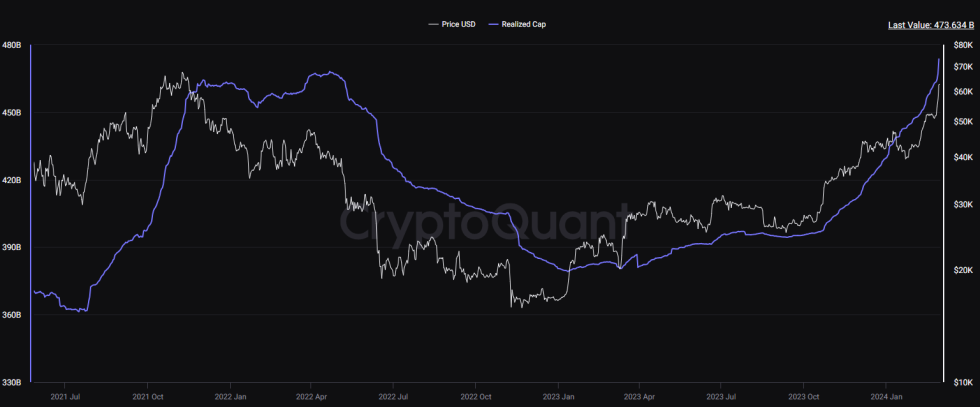
As displayed in the above graph, the Bitcoin Realized Cap has naturally shot up alongside the latest rally in the asset, as buying and selling at higher and higher prices has been occurring.
The metric has now broken through the previous all-time high and has set a fresh record. This suggests that BTC currently has more capital locked in than ever before.
Speaking of buying, as analyst James Van Straten has pointed out in an X post, the Bitcoin investor cohorts appear to be showing aggressive accumulation behavior right now.
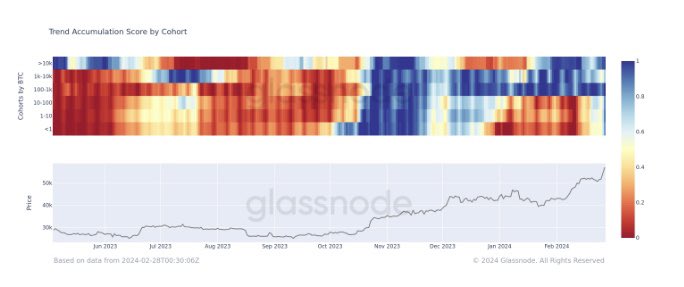
The chart shows the data for the Accumulation Trend Score from Glassnode, which keeps track of the accumulation behavior among the Bitcoin investor groups divided based on wallet amounts.
The graph shows that the entire market has just turned blue, implying that the net balance change in the addresses of all the cohorts has become positive.
Straten notes that there have been three instances in total where such aggressive accumulation has been seen in the sector since November 2022. The first was during the cycle low in November 2022, while the second period kicked off in October 2023 as ETF speculation took place.
With this rapid accumulation occurring, it’s no wonder the Realized Cap of the cryptocurrency has been following a sharp trajectory to the upside.
BTC Price
At the time of writing, Bitcoin is trading at around $62,900, up more than 22% over the past week.