Bitcoin Exchange Outflows & Inflows Hit Historical Highs, Volatility Soon?
Data shows the combined Bitcoin exchange inflow and outflow volume has hit historically significant values, a sign that speculators are active.
Bitcoin Exchange Flow Volume Has Spiked To $4.07 Billion
According to data from the on-chain analytics firm Glassnode, exchange deposits and withdrawals on the Bitcoin blockchain have recently continued to increase.
The relevant indicator here is the “Exchange Flow Volume,” which keeps track of the combined amount of volume flowing into the wallets of all centralized exchanges (that is, the inflows) and that moving out of these platforms (the outflows).
When the value of this metric rises, it means that the investors are moving large amounts of the cryptocurrency in and out of the exchanges currently. Since holders use these platforms for trading purposes, such a trend suggests the interest in buying and selling activities in the market has gone up.
On the other hand, a decline in the indicator suggests trading interest among the investors may be cooling off as they are making fewer transactions related to exchanges.
Now, here is a chart that shows the trend in the 30-day simple moving average (SMA) Bitcoin Exchange Flow Volume over the last few years:
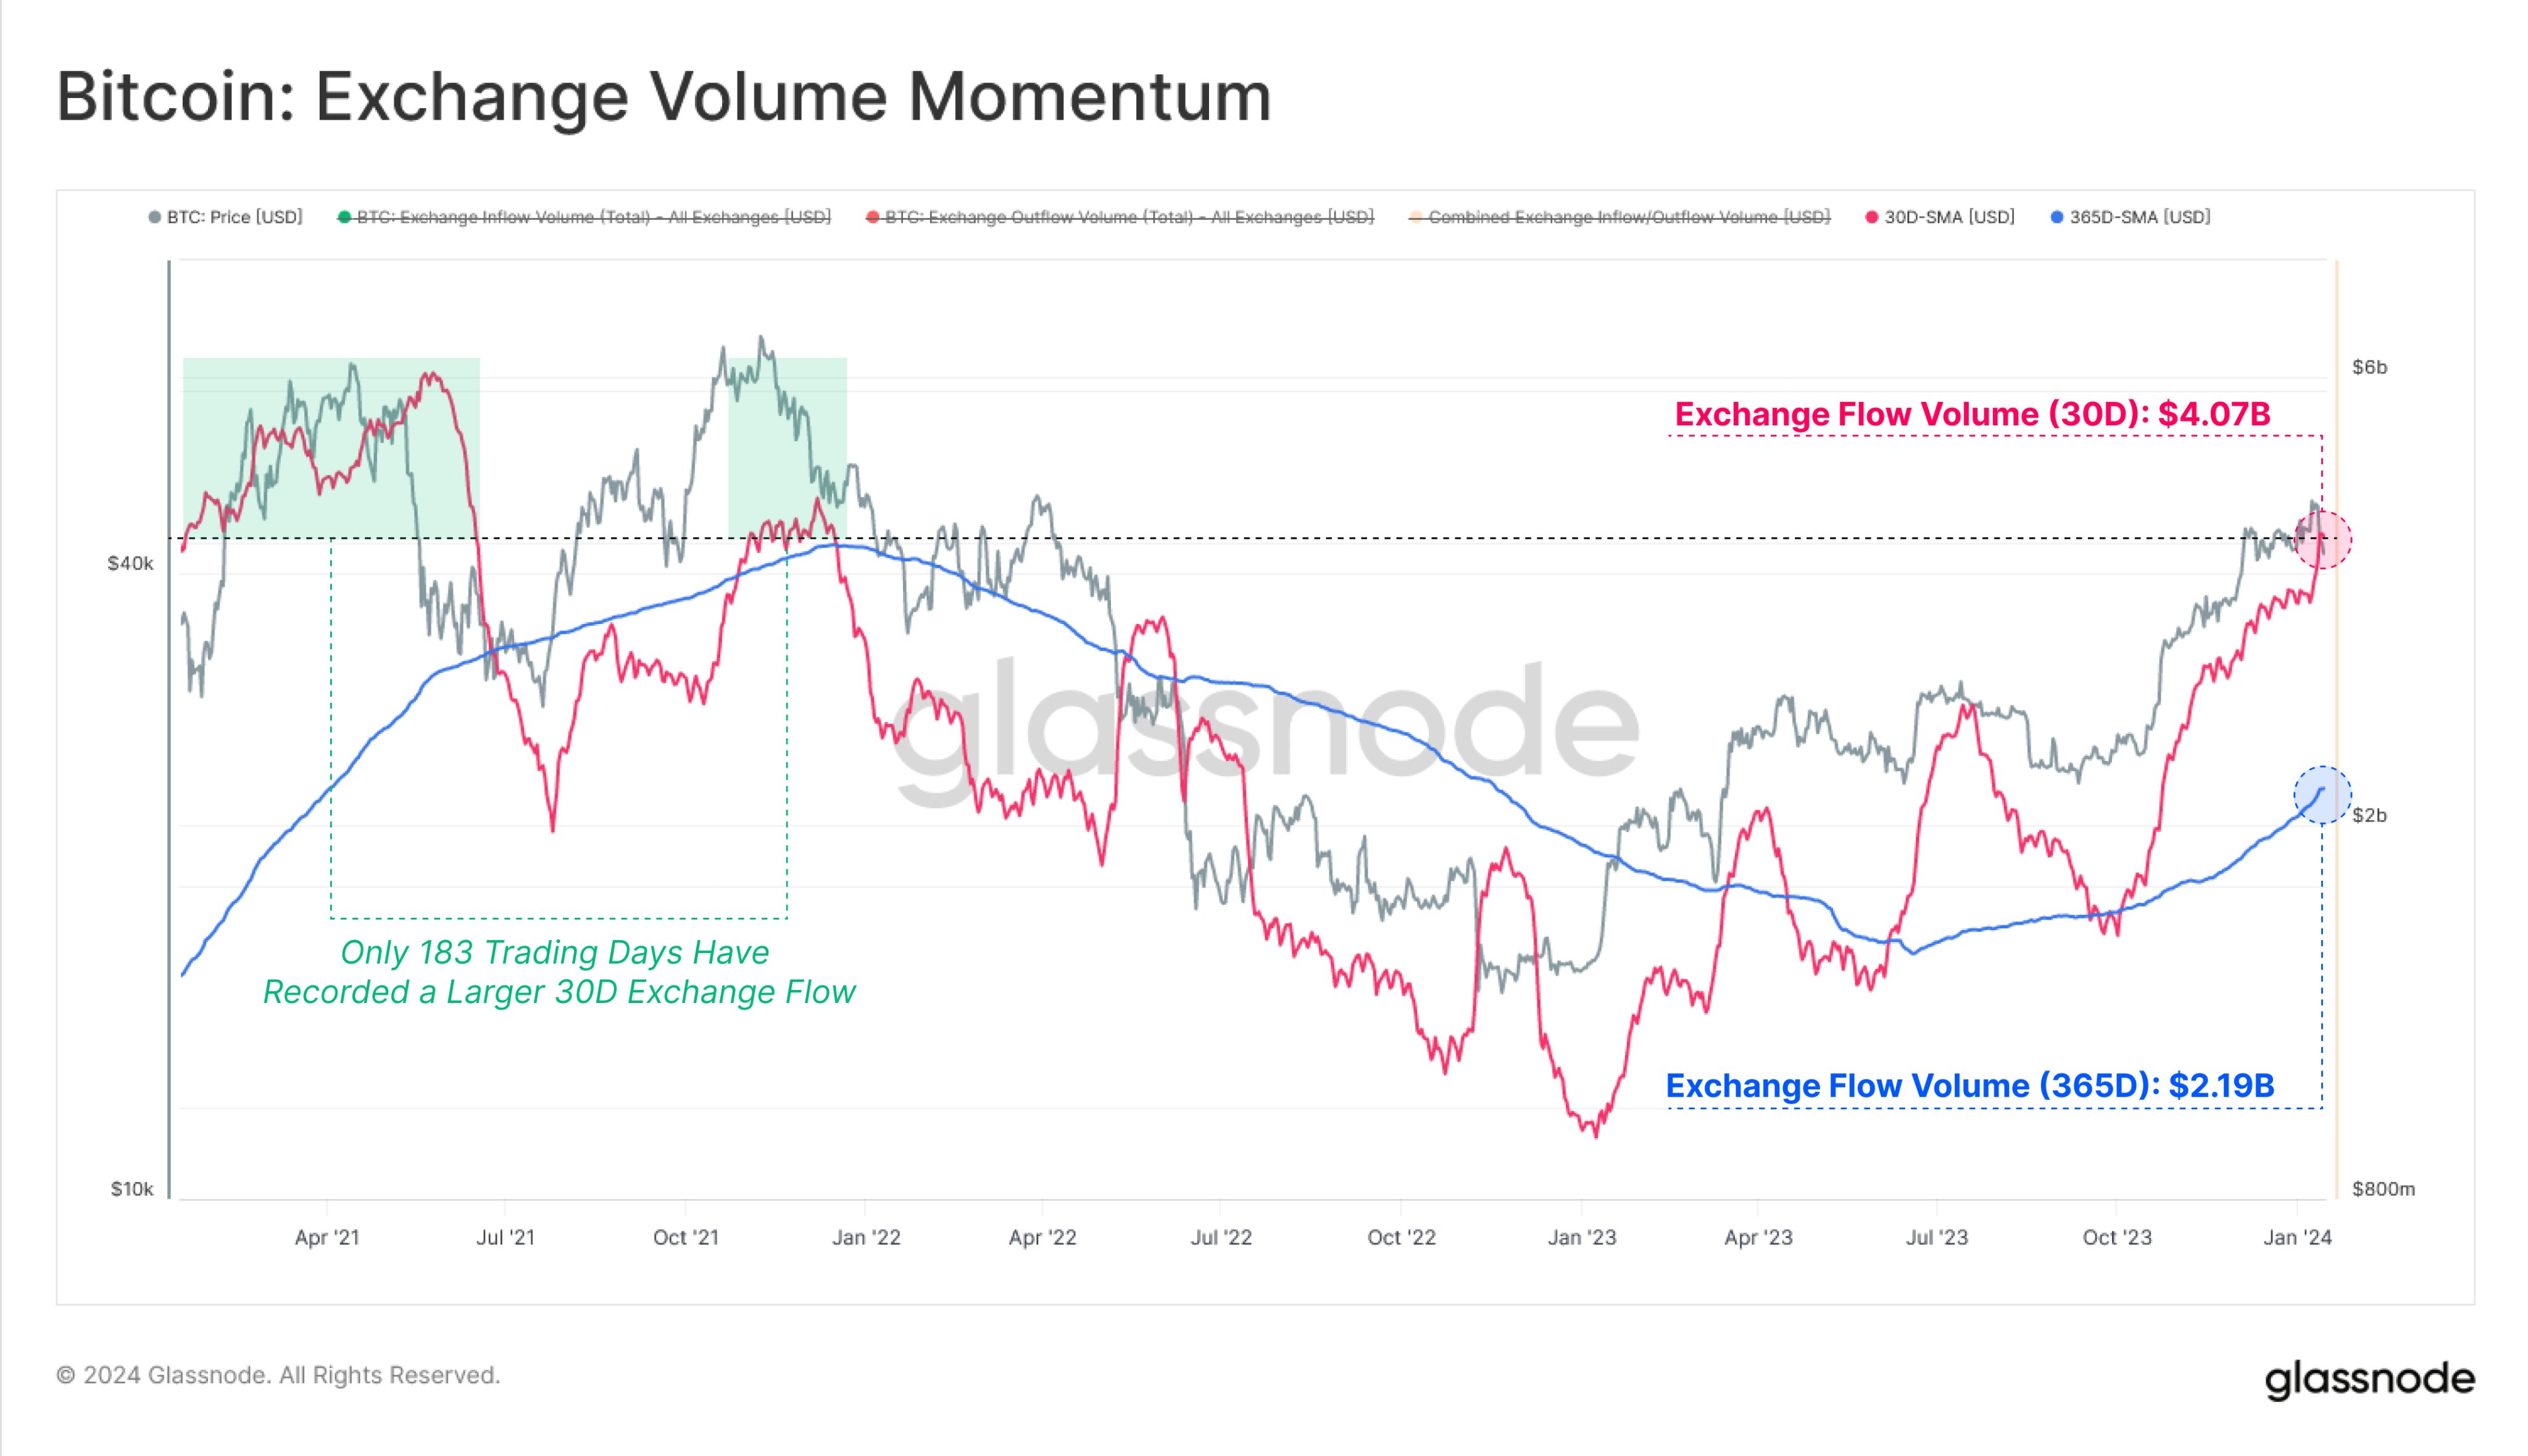
As displayed in the above graph, the 30-day SMA Bitcoin Exchange Flow Volume has recently observed a rapid increase, suggesting that trading interest in the cryptocurrency has been going up.
The reason behind this surge in interest is likely due to the price rise that the asset has gone through in the last couple of months and all the ETF news that has been making the rounds.
However, the latter may actually result in the exchanges losing some volume down the line, as investors are more comfortable with the traditional mode switch towards the now-approved ETFs in favour of Bitcoin (in fact, such a migration may already be underway, as some recent data has suggested).
Following the latest rise in the 30-day SMA Bitcoin Exchange Flow Volume, the indicator’s value has reached more than $4 billion. In the chart, the analytics firm has highlighted the periods where the metric has registered higher values than this.
It would appear that the two peaks of the 2021 bull run were when the exchange outgoings and incomings were at higher levels. “Only 183 Trading Days have recorded a larger Exchange Flow Volume, highlighting the increase in investor speculatory activity,” explains Glassnode.
It’s hard to say exactly what impact the current high exchange flows might have on the cryptocurrency’s price, but the coin may be more likely to show more volatility now as all these speculators make their moves at once.
BTC Price
Bitcoin has gone stale over the last few days as its price has been moving flat around the $43,000 mark. With the current high Exchange Flow Volume, though, it may be a matter of time before the asset deviates from this sideways trend.