Ethereum Active Addresses Spike, What Does It Mean?
On-chain data shows the Ethereum active addresses have observed a large spike recently. Here’s what this could mean for ETH’s price.
Ethereum Daily Active Addresses Have Seen A Surge Recently
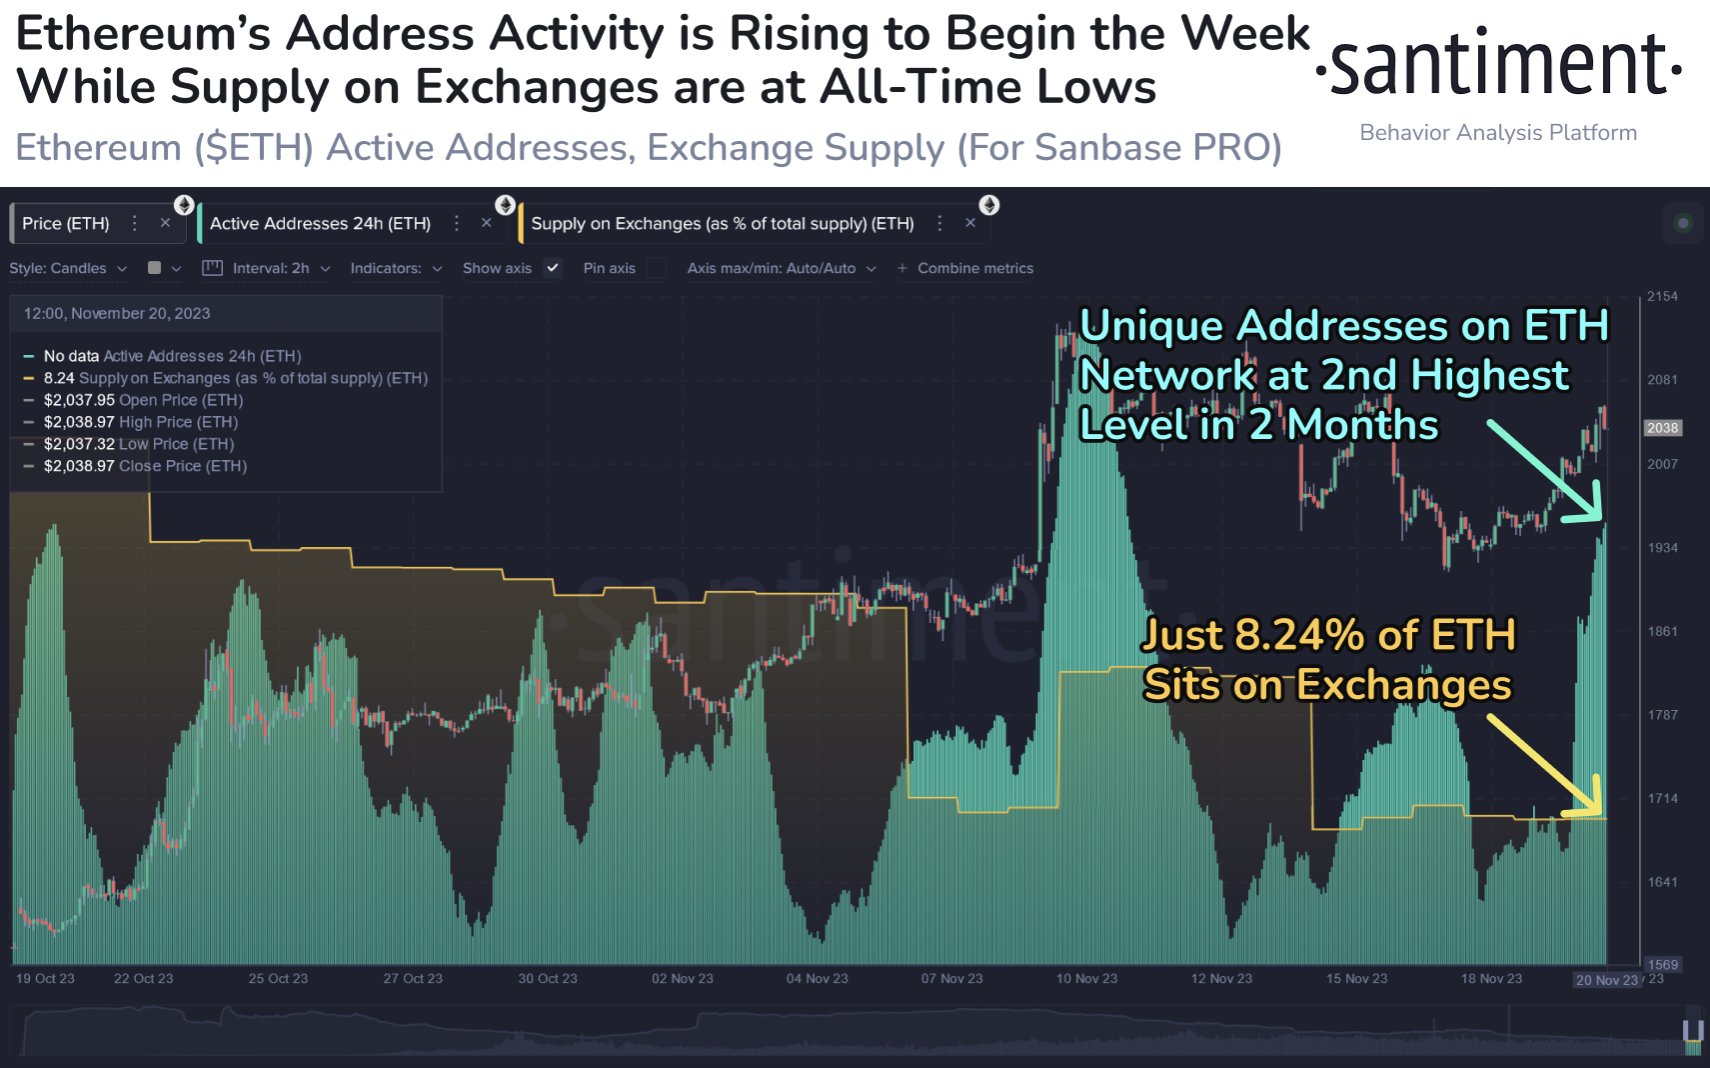
According to data from the on-chain analytics firm Santiment, the ETH active addresses are currently at their second-highest level since the middle of September. The “active addresses” here refer to those addresses on the Ethereum blockchain that are taking part in some sort of transaction activity.
In the context of the current discussion, the unique number of these active addresses is of interest. Note that this metric takes into account both the senders and receivers.
The active addresses may be considered analogous to the unique users present on the network, so their number can provide hints about the degree of traffic that the chain is observing right now.
When the value of the indicator is high, it means that the ETH network is receiving a large amount of traffic currently. This could be a sign that there is high interest in the asset among the traders.
On the other hand, the metric being low implies the market is uninterested in the asset currently as not many users are engaging with the blockchain at the moment.
Now, here is a chart that shows the trend in the Ethereum active addresses over the past month:
As displayed in the above graph, the Ethereum active addresses indicator has seen a spike recently, implying that a large number of holders have started taking part in trades.
Since addresses will become active whether the investor is selling or buying, it’s hard to say exactly what effect this latest activity might have on the asset’s price, but generally, a high-traffic environment is fertile ground for volatility.
From the chart, it’s visible that the active addresses also jumped to high levels earlier in the month. Ethereum first traveled high alongside this rise in user engagement but then the asset topped out and saw a pullback soon after as the metric peaked.
An indicator that may have helped predict this decline in advance could be the combined amount of supply sitting in the wallets of all exchanges. Investors usually transfer their coins to these platforms for selling purposes, so an increase in this indicator could be a sign that there is a selloff going on.
And sure enough, the supply on exchanges registered a jump as the asset saw the aforementioned pullback. As is apparent from the graph, Ethereum hasn’t seen such a spike this time yet, implying that the current address activity may be a sign of buying.
If this is indeed the case, then this high traffic could potentially help fuel the rally and allow Ethereum to visit higher levels.
ETH Price
At the time of writing, Ethereum is trading just below the $2,000 mark, down 3% in the past week.