Stablecoin Market Continues To Drain Capital, But USDT Expands
Data shows the stablecoin sector as a whole has continued to observe net outflows recently, but Tether (USDT) has only expanded further.
USDT’s Dominance Among The Stablecoins Has Now Grown To Nearly 70%
In its latest weekly report, the on-chain analytics firm Glassnode has looked into the capital flows into and out of the cryptocurrency market to see how the sector has been doing recently.
To check for these capital flows, the firm has considered the change in the valuations of three asset classes, Bitcoin (BTC), Ethereum (ETH), and stablecoins, since these three make up most of the digital asset sector.
Now, here is a chart that displays the data for these netflows over the last few years:
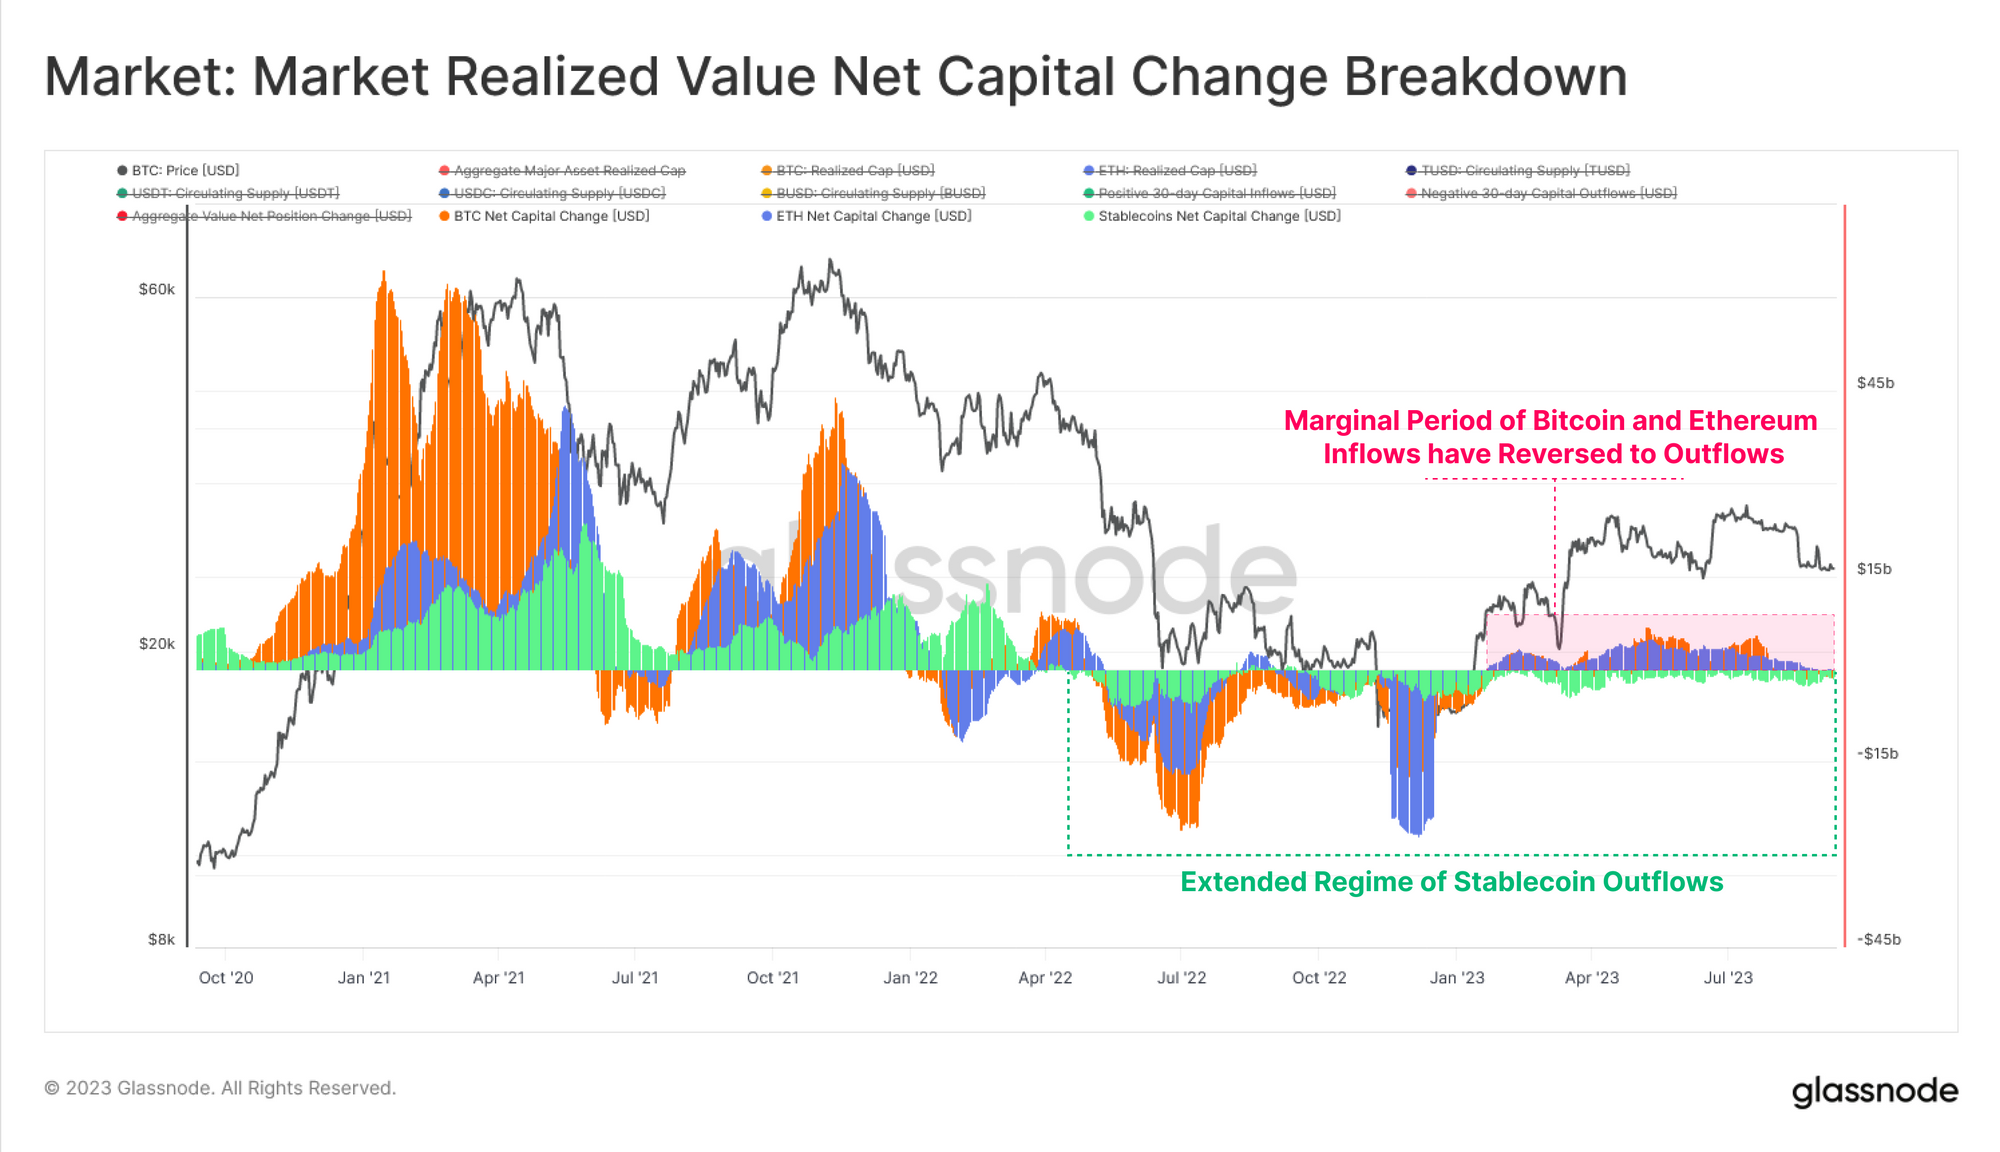
As shown in the above graph, the stablecoin netflows have been negative since April 2022, meaning that capital has constantly been exiting the sector. Bitcoin and Ethereum were also seeing outflows at first inside this period until the year 2023 rolled around and they flipped towards inflows.
Recently, however, both these assets have approached neutral or negative netflows, implying that capital is once again exiting the cryptocurrency sector as a whole. This can suggest that there isn’t much interest in investing in the sector right now.
In total, the stablecoins have seen the exit of $43 billion, suggesting a sizeable decline of 26% inside this period. The aggregate stablecoin market cap has now fallen to just $120 billion, as the below chart highlights.
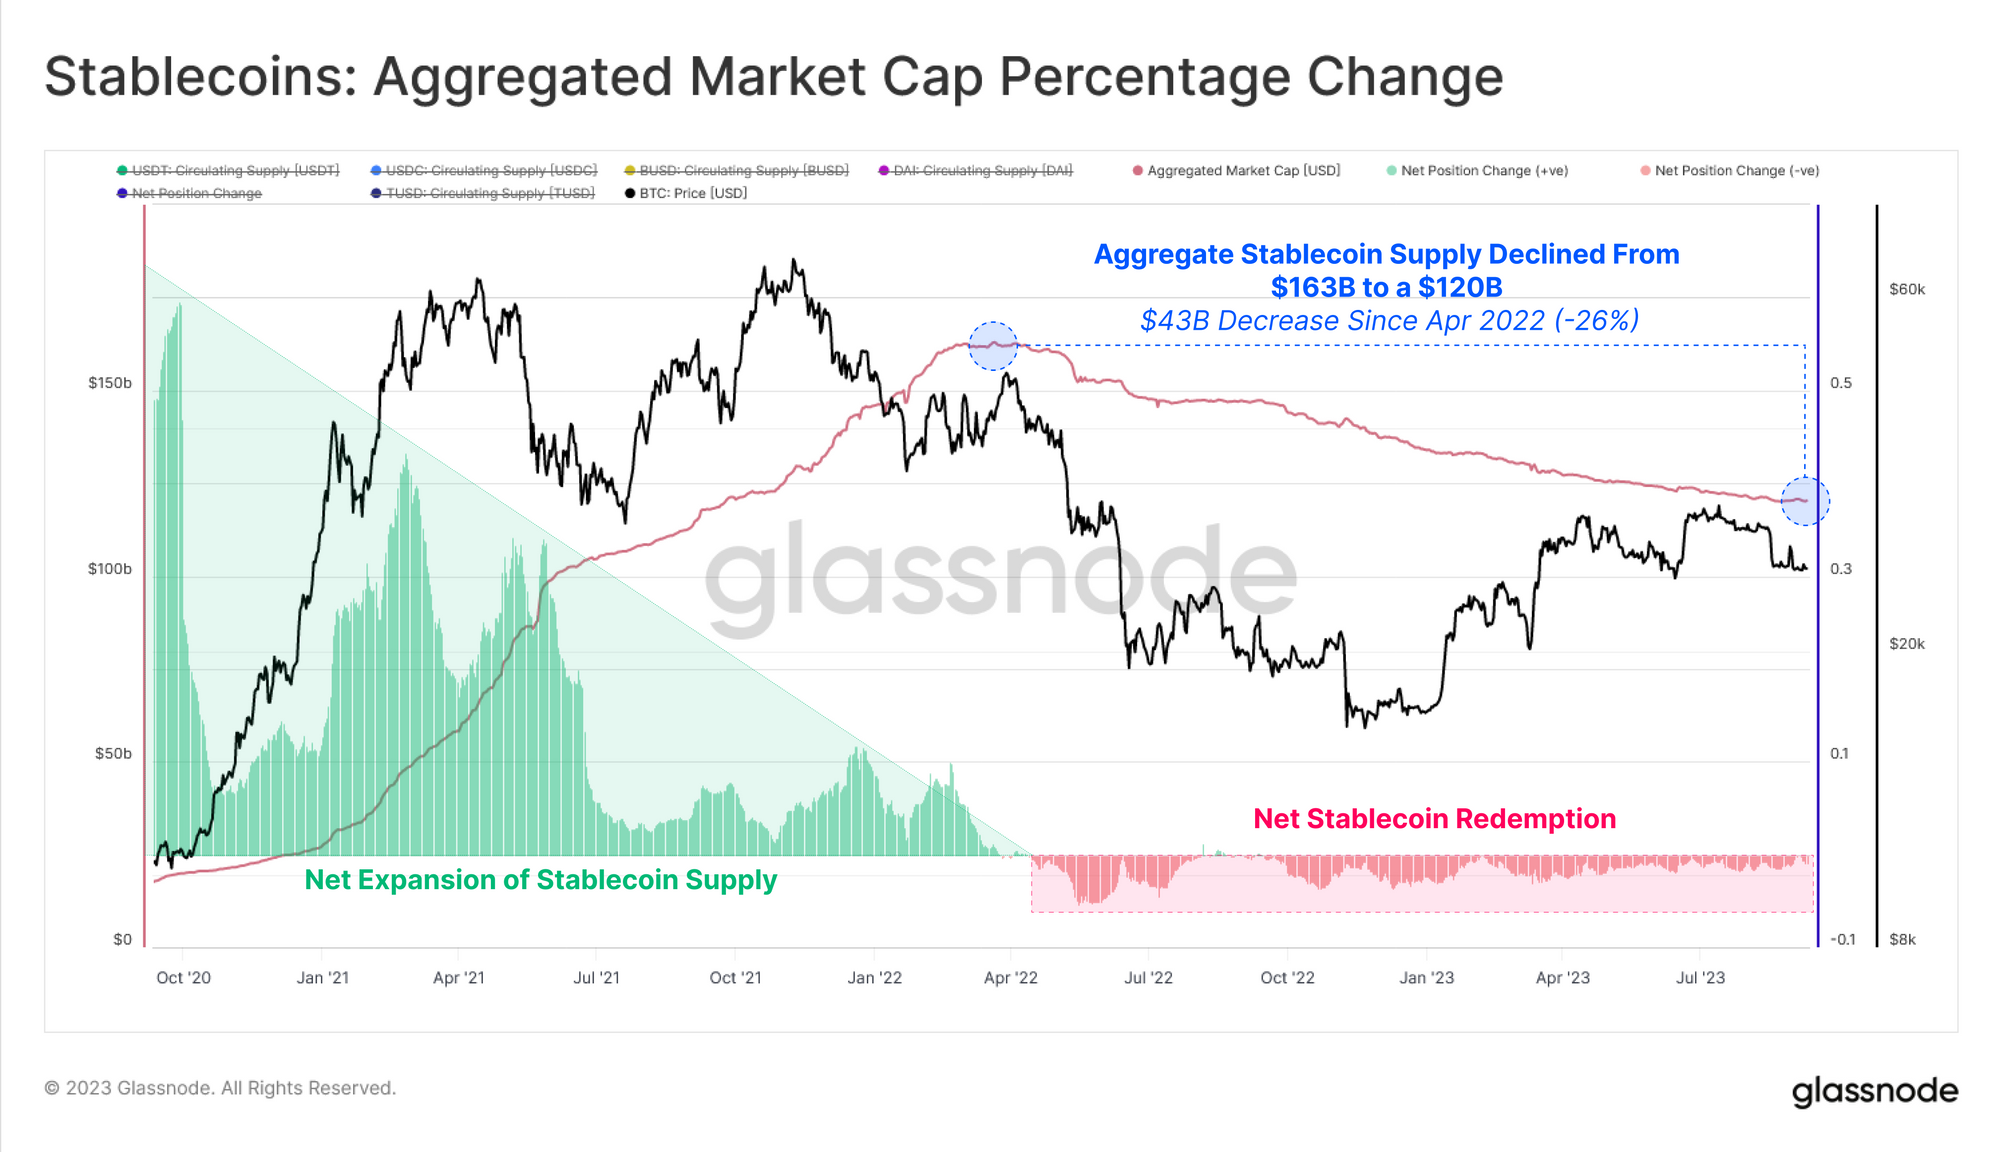
“This can be argued to be a result of both capital leaving due to bear market conditions, but also a reflection of the opportunity cost of higher interest rates, which are not passed onto non-yielding stablecoins,” explains the report.
While the stable sector as a whole has continued to bleed recently, a breakdown of the supplies of the major stablecoins reveals that this decline hasn’t been something consistent throughout the assets.
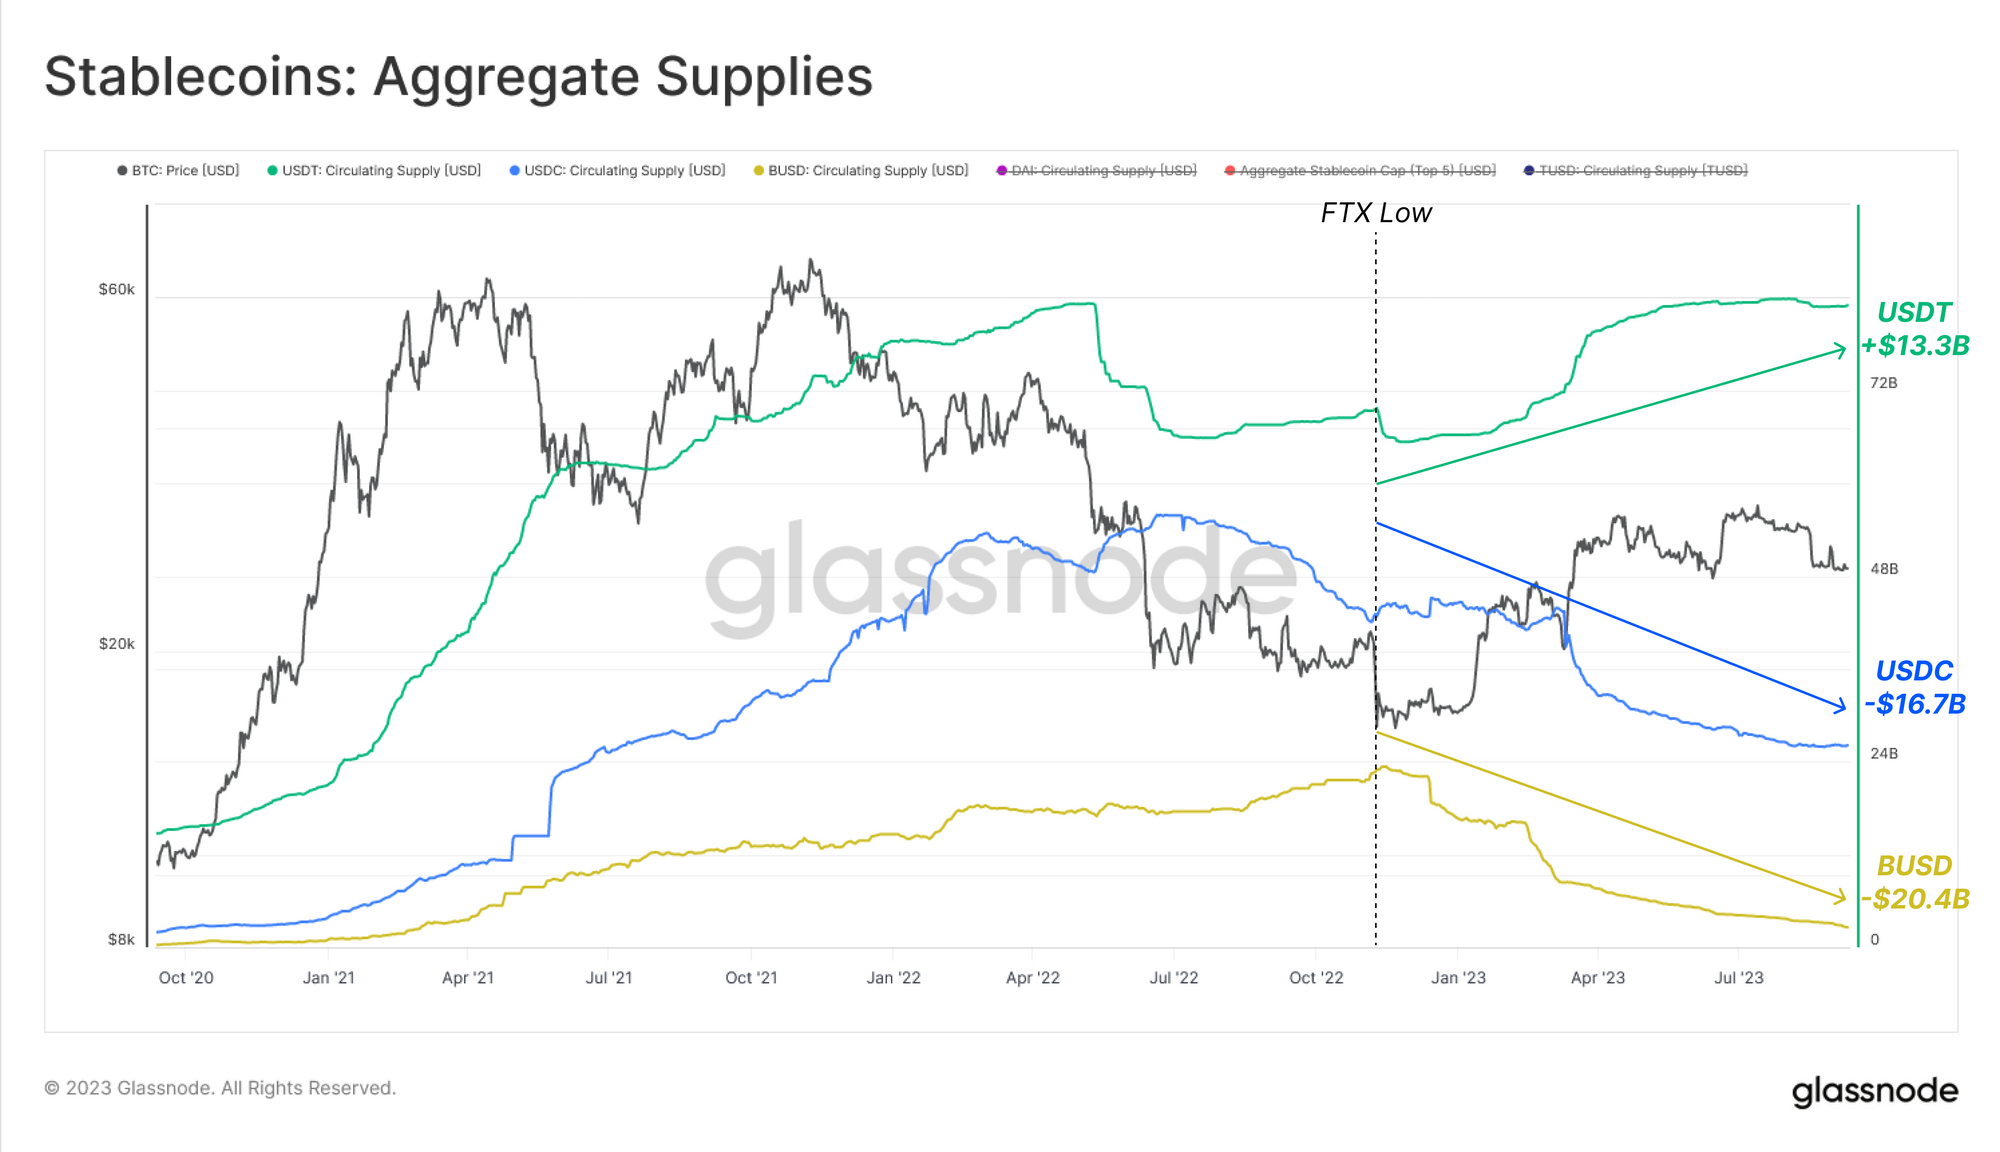
From the chart, it’s visible that Tether (USDT) declined hard between April 2022 and the FTX crash, while USD Coin (USDC) saw a more gradual plunge. BUSD didn’t decline in this period at all.
Since the FTX low, though, USDT has turned itself around and has observed a rise of $13.3 billion in its supply. On the contrary, USDC and BUSD have both seen large declines of $16.7 billion and $20.4 billion, respectively.
Back in June, Tether’s dominance had hit a low of 44%, but due to these opposite flows, the number one stablecoin’s market share has seen a dramatic rise to the 69% mark.
BTC Price
After initially plunging down towards the $25,000 level, Bitcoin has seen a quick turnaround during the past day as the asset has recovered back above $26,000.