Bitcoin Exchange Supply Sees 3.1% Increase, What Does This Mean?
On-chain data shows the Bitcoin exchange supply has registered an increase of 3.1% during the past two weeks. Here’s what this could mean.
Bitcoin Supply On Exchanges Has Been Going Up Recently
According to data from the on-chain analytics firm Santiment, exchanges have recently received significant BTC deposits. The “supply on exchanges” refers to the percentage of the total circulating Bitcoin supply currently sitting in the wallets of all centralized exchanges.
When this metric’s value goes up, the investors are depositing a net number of coins to these platforms. Generally, one of the main reasons why holders would choose to transfer their coins to exchanges from their self-custodial wallets is for selling-related purposes.
Due to this reason, whenever the indicator’s value trends up, it can be a potential sign that the market is gearing up for a selloff, which can naturally be bearish for the price.
On the other hand, lowering the metric values implies that a net amount of the supply is leaving these platforms right now, which may suggest that the investors are accumulating. This reduced possibility of selling taking place can be bullish for the price in the long term.
Now, here is a chart that shows the trend in the Bitcoin supply on exchanges over the past few months:
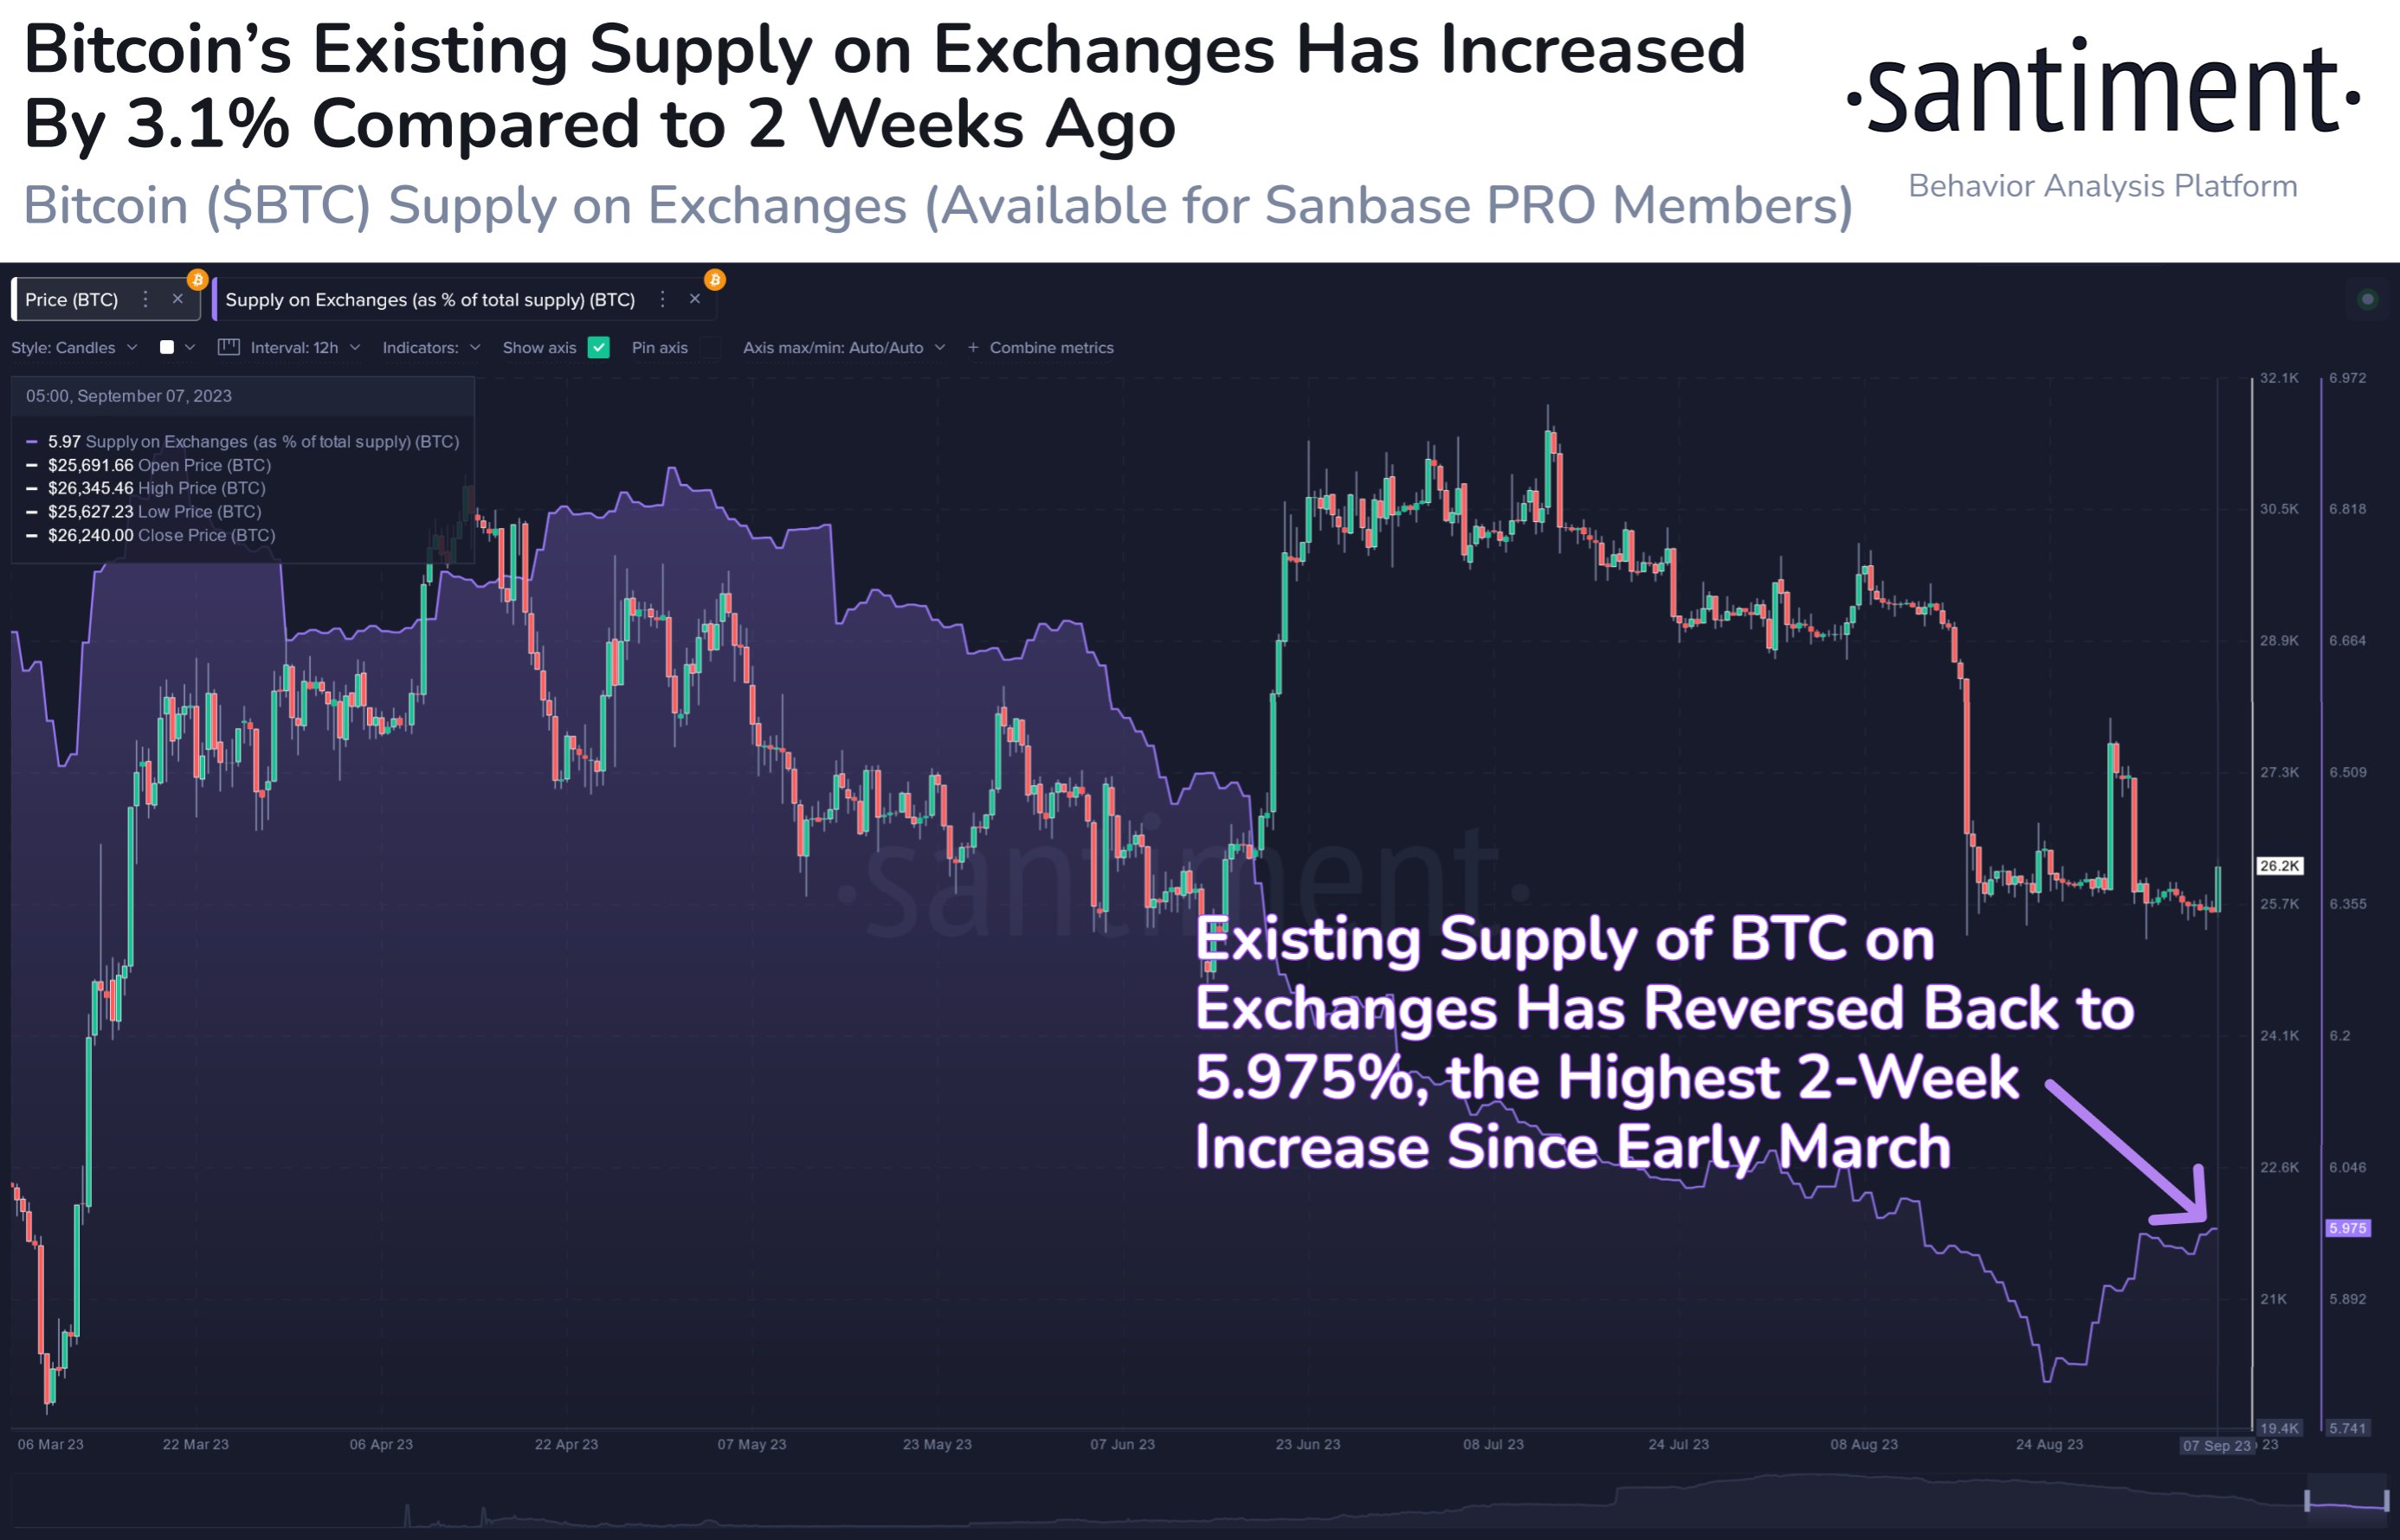
As displayed in the above graph, the Bitcoin supply on exchanges had been constantly declining during the past few months, but things have recently changed for the indicator.
During the past couple of weeks, the metric has reversed its trend and has observed a rise of 3.1%. This bi-weekly increase in the supply on exchanges is the highest observed since early March.
Many of these deposits had come in the leadup to and during the Grayscale rally. Since that price surge couldn’t last long, it would seem reasonable to assume that the investors had made the transactions to these platforms for selling.
Instead of resuming its downtrend after the price plunge, the indicator has only continued to go higher in the last few days, as its value has now hit the 5.975% mark.
Santiment notes that this is a sign that the investors are motivated to take whatever small profits they can, hence why they have deposited to prepare for exit opportunities.
Bitcoin Has Already Retraced Its Surge Towards $26,400
During this past day, BTC had observed an uplift towards the $26,400 level, but during the last few hours, the asset has already returned to the $25,800 mark.
This quick retrace for the coin could suggest that the investors who had been ready with their deposits have pulled the trigger on their selling, thus providing a bearish impulse to the asset.