Here’s What Could Trigger A Rebound For Ethereum
Here are two Ethereum metrics that are currently showing values that may lead to a rebound for the cryptocurrency’s price.
Ethereum Could Rebound Off The Current Market FUD
According to data from the on-chain analytics firm Santiment, the crowd seems to have started to bet against ETH in the past few days. There are two metrics of relevance here: the Binance Funding Rate and the Social Dominance.
First, the “Binance Funding Rate” keeps track of the periodic fee that Ethereum derivative contract holders on the Binance platform are paying to each other currently.
Related Reading: Bitcoin Long-Term Holders Stay Strong, Show Little Reaction To Crash
When the value of this metric is negative, it means that the short holders are paying the long investors right now. Such a trend suggests that a bearish mentality is the dominant force in the market.
On the other hand, positive values imply a bullish sentiment is shared by the majority as the long investors are paying a premium to the shorts in order to hold onto their positions.
Now, here is a chart that shows the trend in the Ethereum Binance Funding Rate over the past few months:
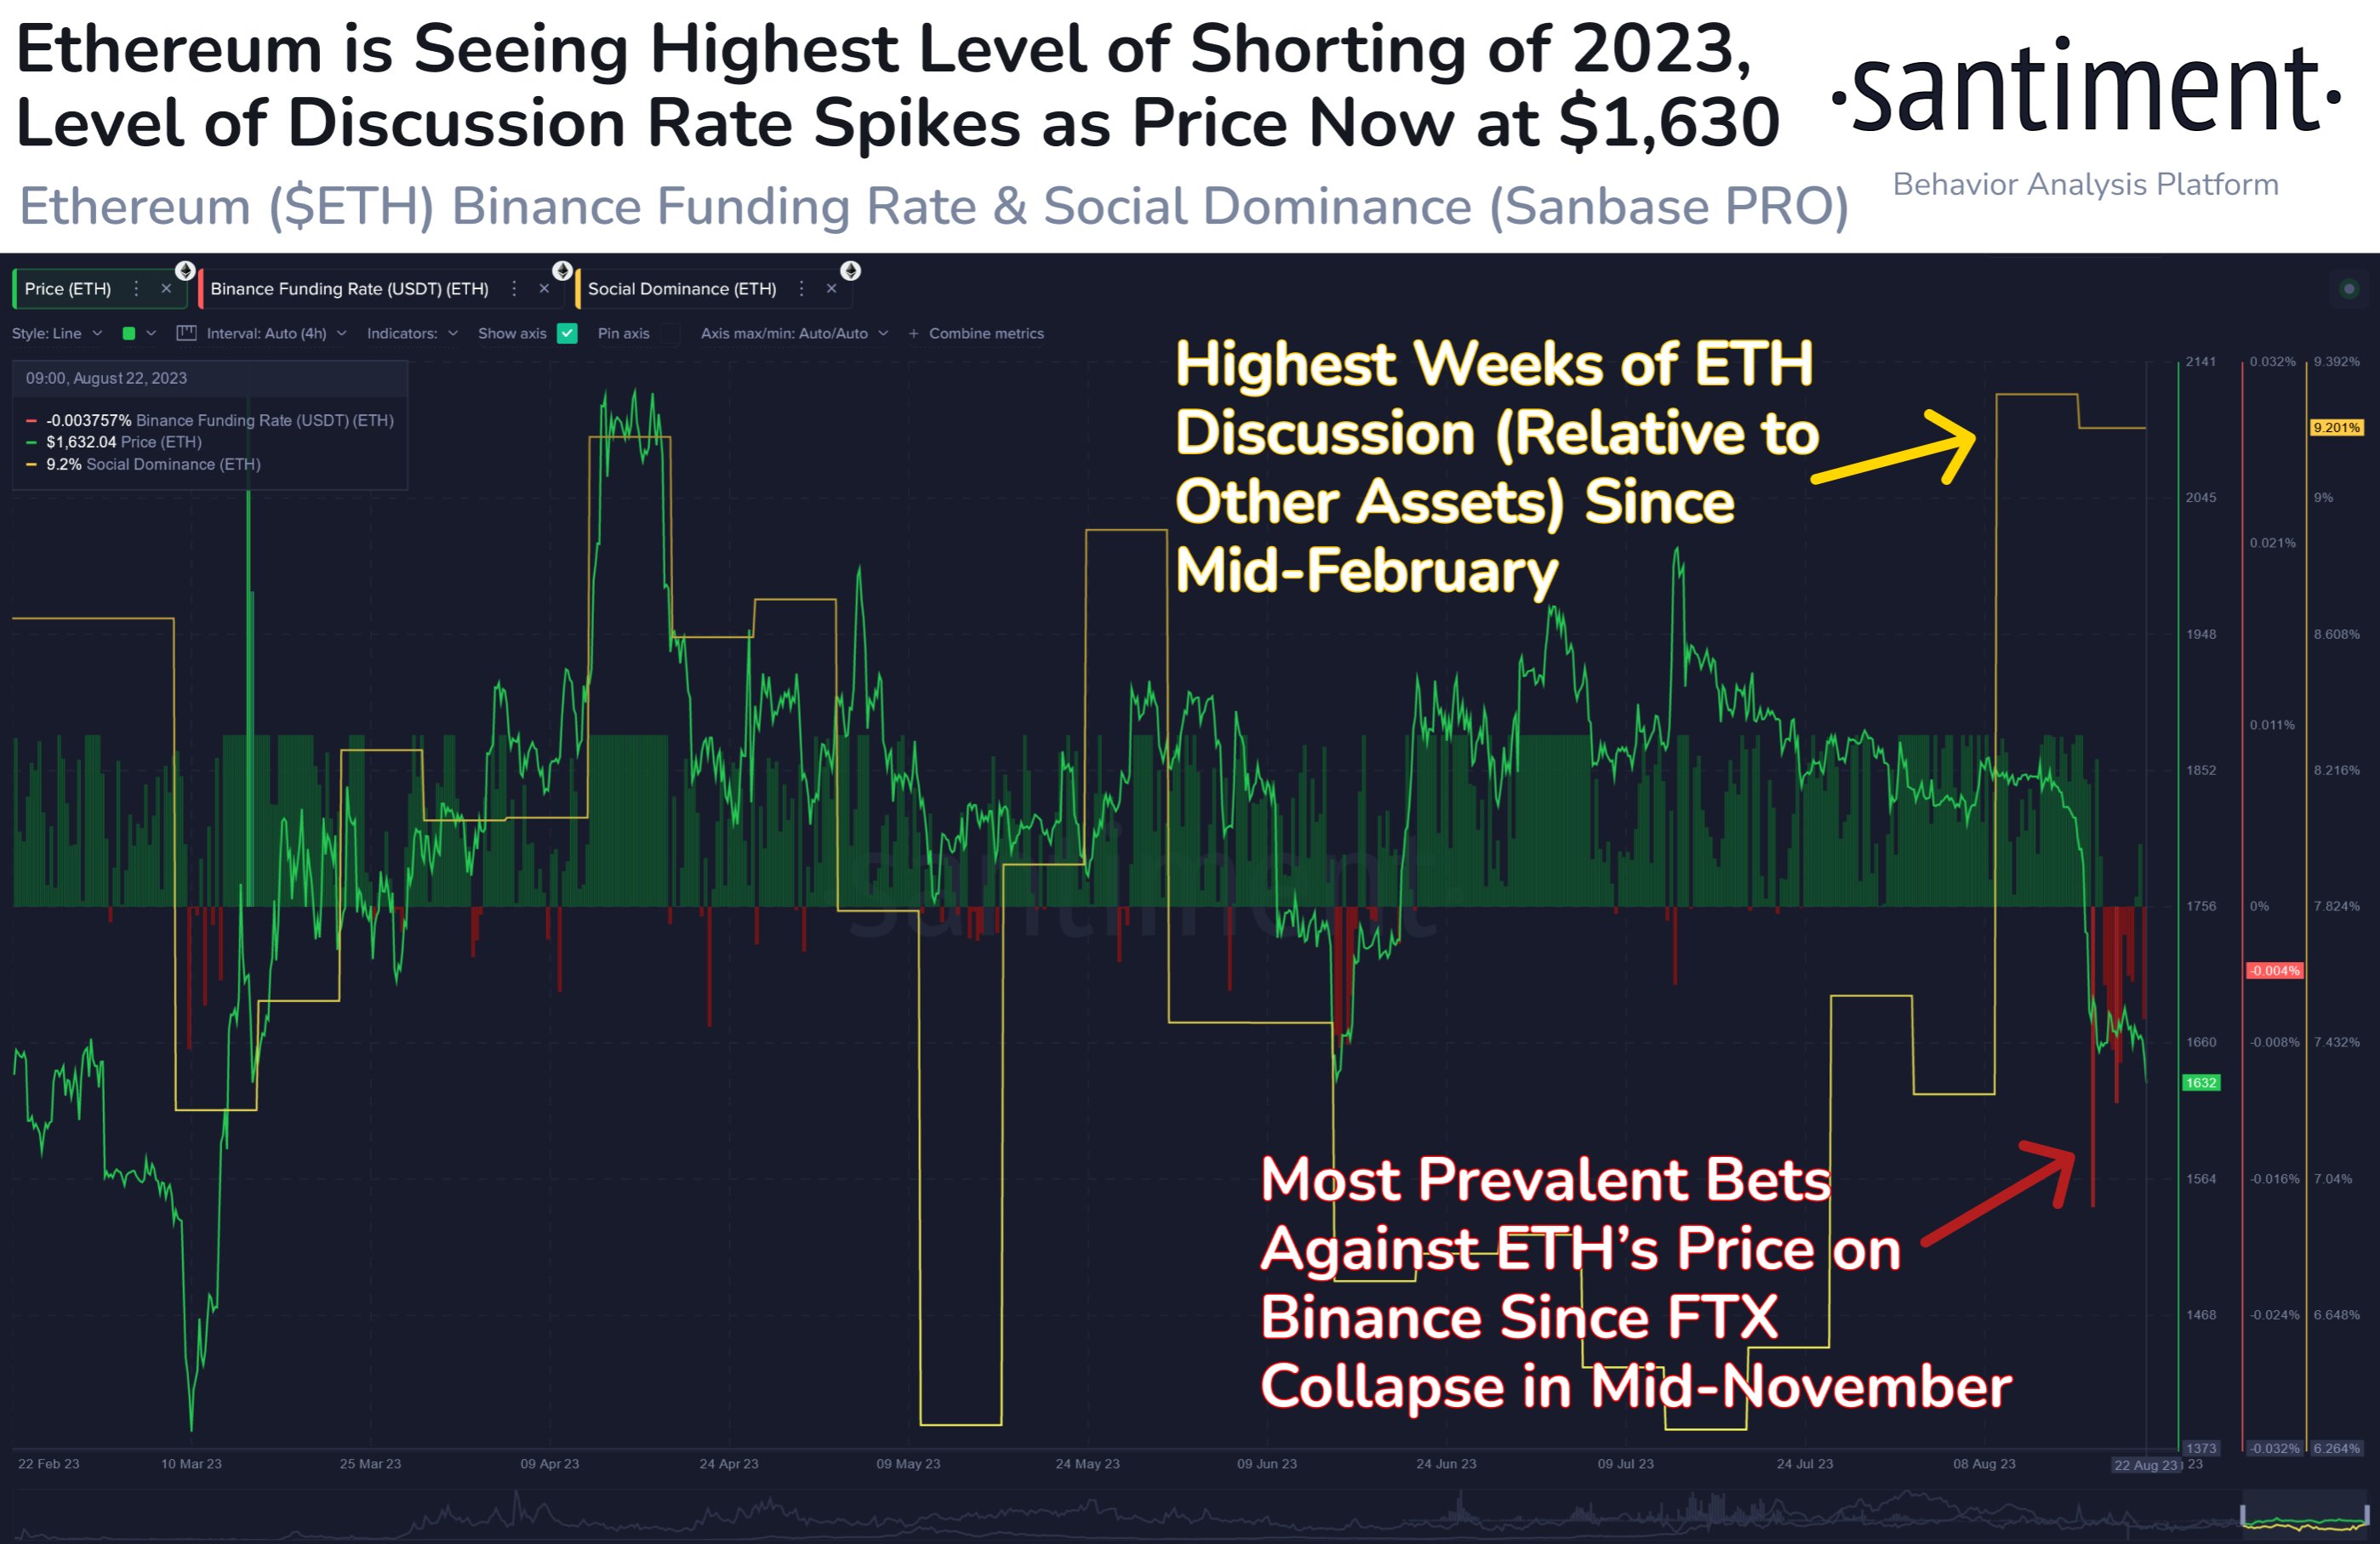
As displayed in the above graph, the Ethereum Binance funding rate had been positive right before the crash, but following it, the metric quickly turned highly negative.
The reason behind this quick shift was the fact that the long holders had been liquidated in the crash, while speculators had quickly jumped in to short while the opportunity still appeared to be there.
The funding rate has become less negative over the past few days, but it still remains at notable red values nonetheless, implying that the majority of the investors are still betting against the cryptocurrency.
The chart also shows the data for the other indicator of interest here, the “social dominance.” This metric tells us about the amount of discussion that Ethereum is receiving on the major platforms, relative to the top 100 assets in the sector.
As is visible in the graph, this indicator had been at relatively high values during the lead-up to the crash, implying that a large number of investors had been talking about the asset.
It’s hard to say which way these discussions were leaning from this indicator alone, but with the surrounding context like the funding rates being positive, it may be a safe assumption that these talks were a sign of optimism and hype in the market.
Historically, Ethereum and other markets have tended to show moves contrary to what the majority of traders are expecting. This effect may have been in play when ETH crashed after the discussions around the coin had hit high levels.
The social dominance of the coin hasn’t calmed down after the crash, meaning that investors continue to engage in a high amount of talk about the asset. Given the shift in the sentiment on the derivative market, though, it’s possible that these high discussions are now reflecting the degree of FUD that’s present in the sector.
Just like how the optimism potentially led to the crash earlier, this current FUD can instead result in a rebound for Ethereum, with the shorts that have now piled up possibly acting as fuel through a mass liquidation event.
ETH Price
At the time of writing, Ethereum is trading at $1,642, down 10% in the last week.