Bitcoin Plummet Sends 10% Of Supply Into Loss
On-chain data shows Bitcoin’s plummet toward the $26,500 mark has sent 10% more of the total supply into a state of loss.
Bitcoin Supply In Profit Has Dropped From 71% To 61% After The Crash
According to data from the on-chain analytics firm Glassnode, the supply in profit has taken a big hit with this price plunge due to the market previously being “top-heavy.”
The “percent supply in profit” here is an indicator that measures the percentage of the total circulating Bitcoin supply that’s currently carrying some amount of unrealized loss.
The metric works by going through the on-chain history of each coin to see what price it was last moved at. If this previous selling price for any coin was less than the current spot price of the asset, then that particular coin is said to be carrying a gain. The supply in profit metric then naturally adds the coin to its count.
Related Reading: Crypto Futures Liquidations Hit $150 Million As Bitcoin Plummets
Coins that don’t fulfill this criterion are put under the loss category, which the “supply in loss” keeps track of. The value of this counterpart indicator of the supply in profit can also simply be calculated by subtracting the supply in profit from 100.
Now, here is a chart that shows the trend in the Bitcoin percent supply in profit over the last few months:
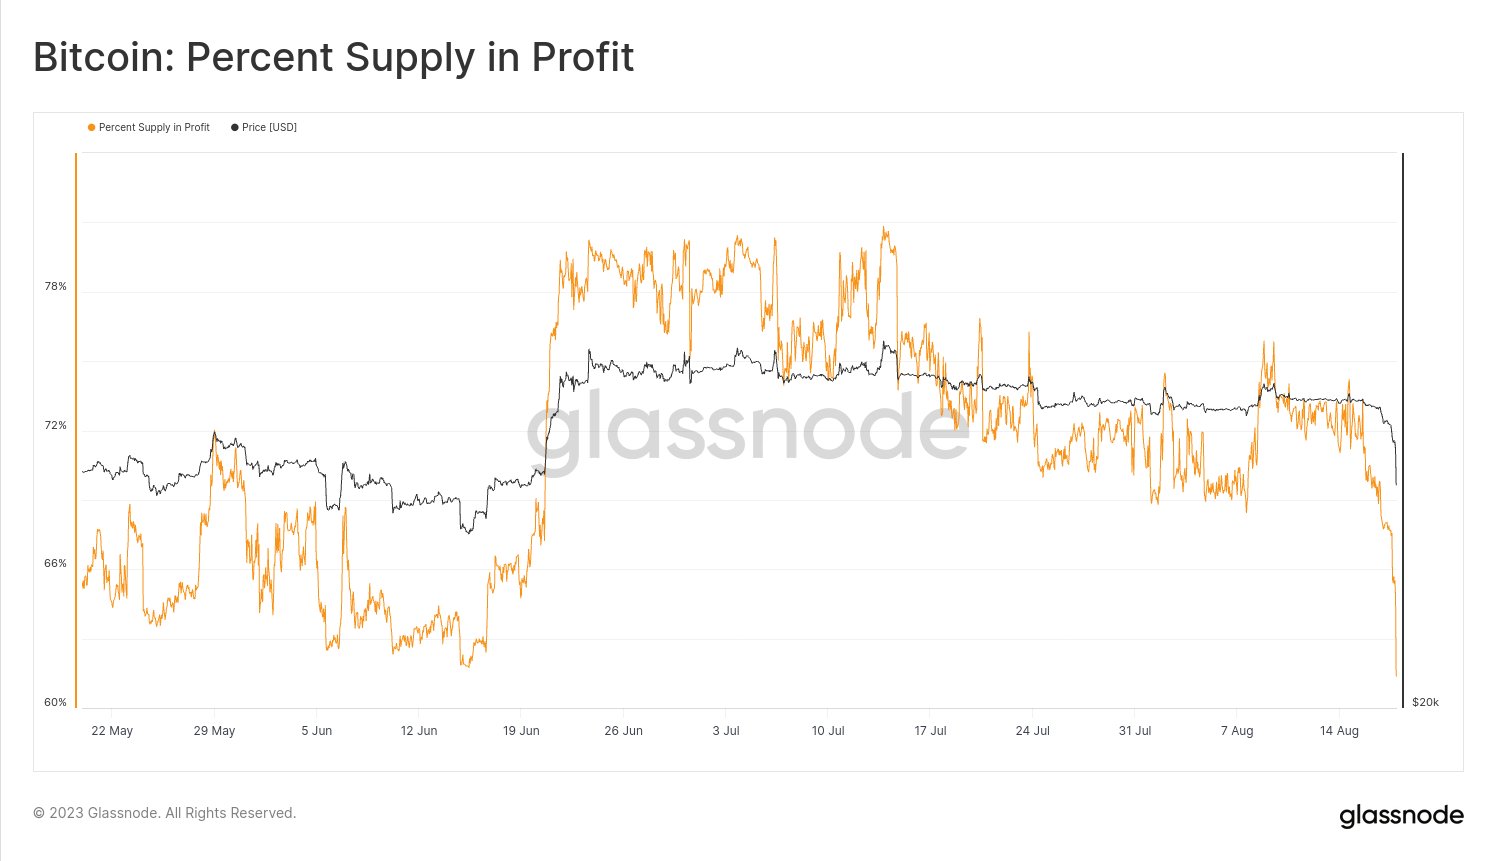
As displayed in the above graph, the Bitcoin percent supply in profit has observed a sharp drawdown as the cryptocurrency’s price has crashed. Prior to this plunge, the indicator’s value was around 71%, but now it has decreased to just 61%.
Obviously, this means that the majority of the supply is still in a state of profit, but 10% of the supply going underwater so suddenly is still quite a significant change.
The reason behind this extraordinary plummet in the indicator lies in the distribution of realized prices in the market that was present just before this crash.
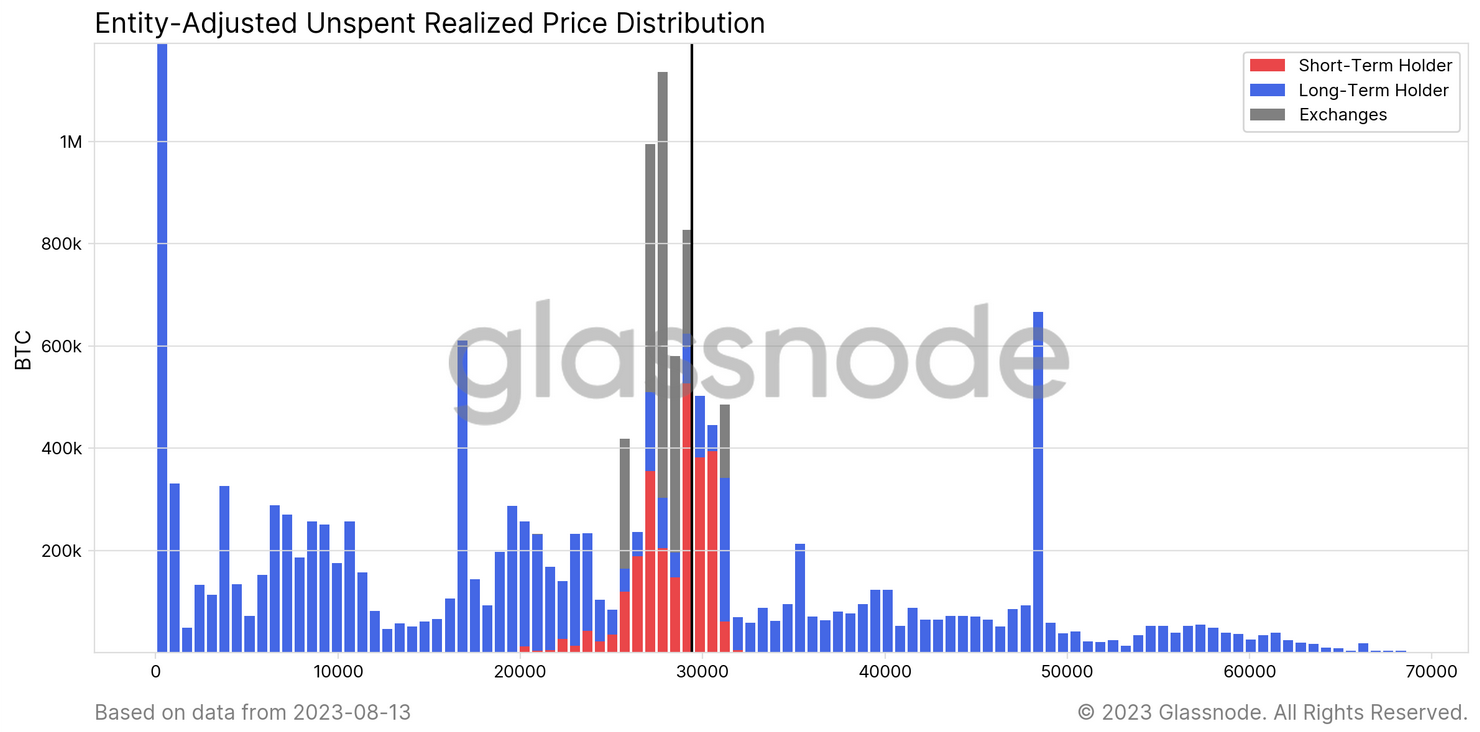
In brief, what this metric tells us about is how much supply the investors buy at what prices. From the chart, it’s visible that the supply was particularly concentrated at levels near the $30,000 mark before the latest crash.
This means that a large number of holders had bought into the market at those prices. This isn’t particularly surprising, as Bitcoin had been stuck in consolidation around these price levels for quite a while.
As investors continued to buy and sell in this sideways period, the cost basis of the average investor naturally registered a rise, and the distribution started to become top-heavy.
Top-heavy markets are quite sensitive to movements in the price, as a large number of holders can suddenly go into loss or profit with them. Thus, the 7% plunge that Bitcoin has seen in the past 24 hours has also resulted in a significant shift in the profit-loss balance of the sector.
BTC Price
At the time of writing, Bitcoin is trading around $26,500, down 10% in the last week.