Bitcoin Boredom Could Continue For 6 More Months: Glassnode
Data from Glassnode suggests that the current Bitcoin boring price action may very well go on for another six months.
Bitcoin’s Sideways Slump May Not Be Near Finishing Yet
In its latest weekly report, the on-chain analytics firm Glassnode has discussed how the current lack of BTC volatility has compared to similar slumps during the previous cycles.
Related Reading: Cardano Slips Down 5%, But Sharks & Whales Continue To Buy
To stack the cycles against each other, Glassnode has used the “price performance since ATH” metric, which keeps track of the percentage performance of Bitcoin relative to the last all-time high.
Here is a chart that compares the different BTC cycles using these criteria:
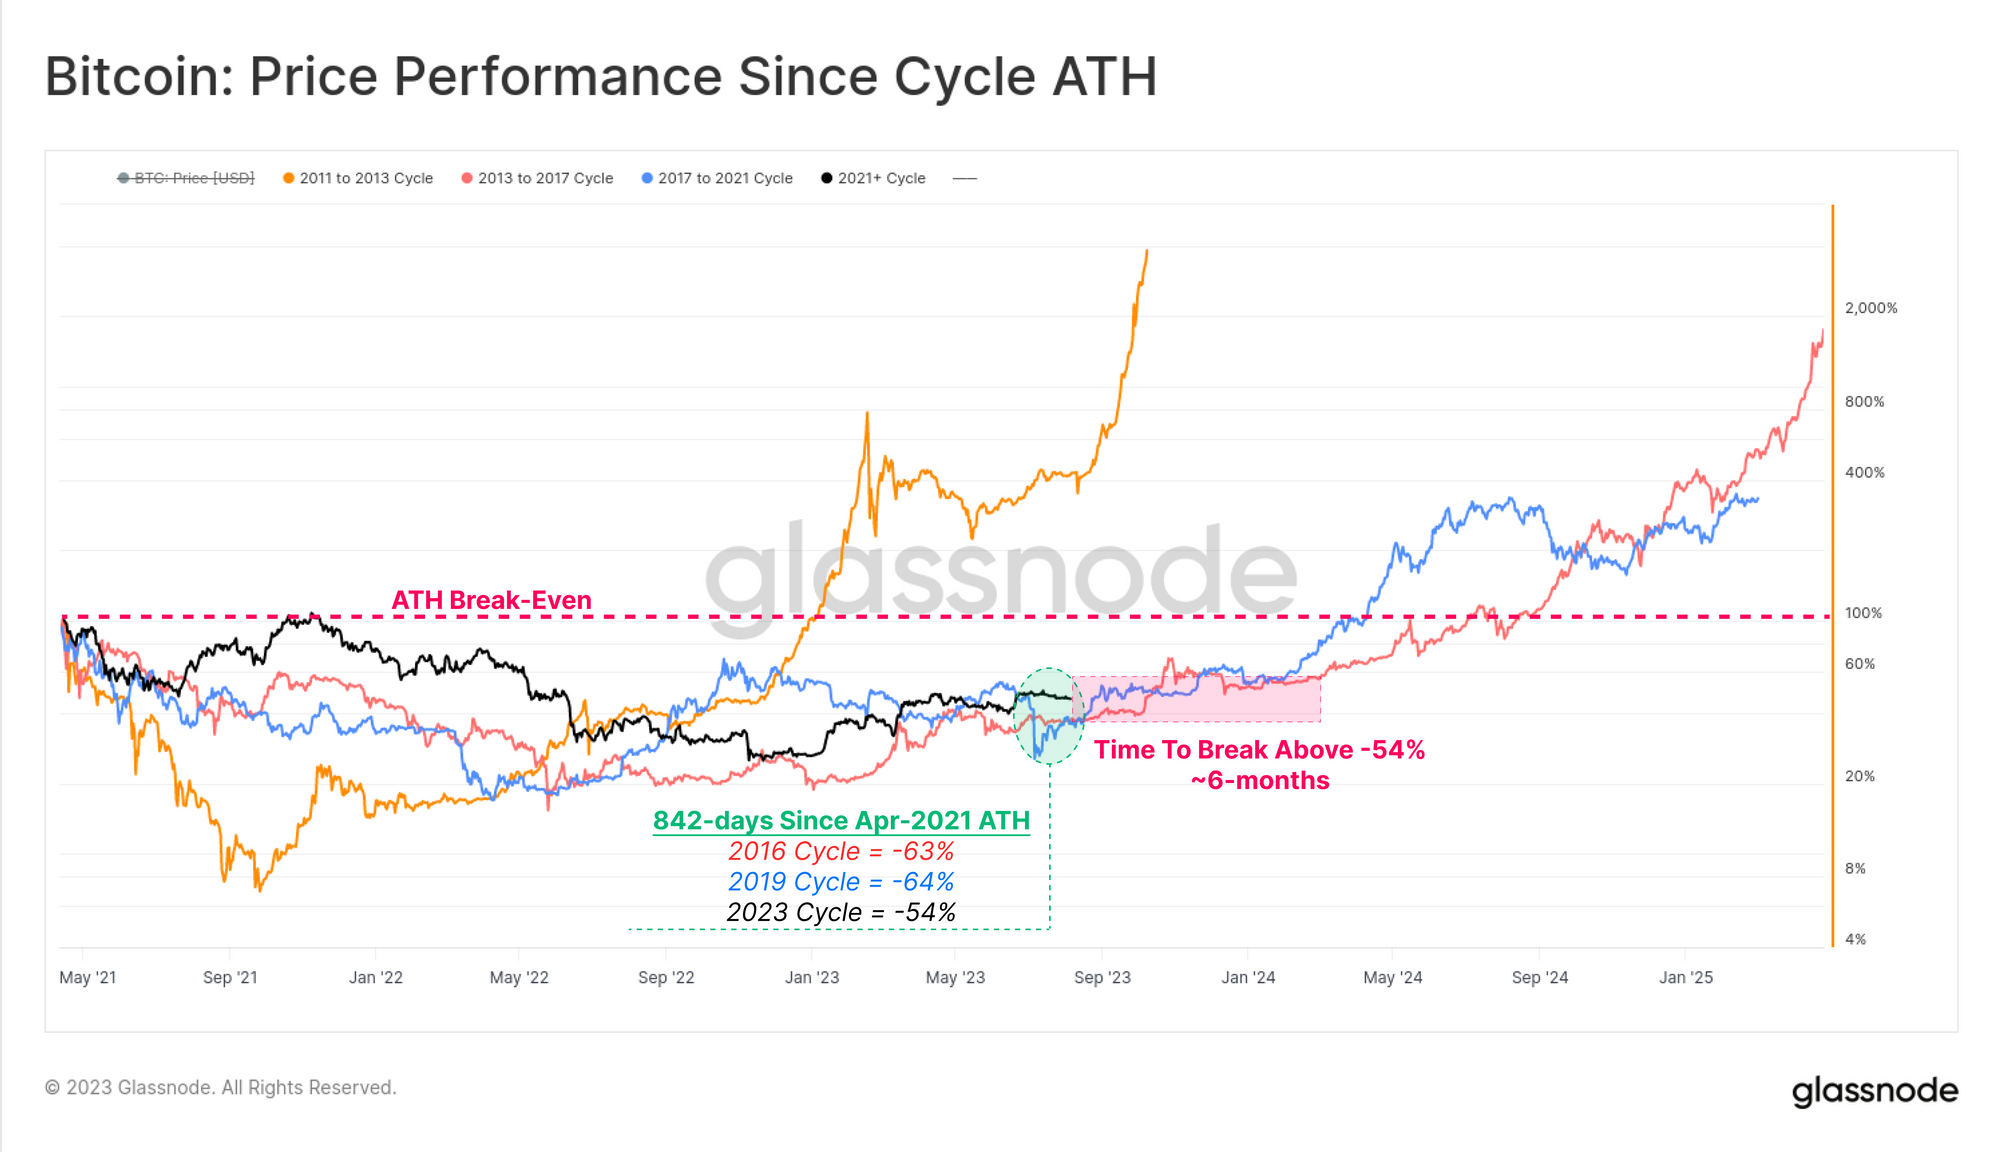
One thing that immediately stands out in this graph is that Glassnode has used the April 2021 top as the bull market peak here (and hence, also the starting point of the “price performance since cycle ATH” for this cycle). This is despite the fact that the November 2021 top was where Bitcoin actually set its current all-time high value.
The reason behind this is that the analytics firm believes the bear-market sentiment actually began during the May 2021 selloff, due to several indicators showing bearish divergences starting from the selloff.
The rally in the second half of 2021 was abnormal in this sense, as the underlying metrics didn’t indicate it to be an actual bull market. Perhaps this was partially a result of the unusual circumstances the rally occurred in, as the COVID stimulus checks from the US government provided fuel that may otherwise not have been there.
From the chart, it’s visible that the current cycle has now spent 842 days since the April 2021 peak and the price has gone down by 54% in this period. In the previous cycle, the price was 64% down at the same point in the timeline, while it was down 63% in the cycle before that.
Interestingly, this suggests that the current price recovery so far has fared better than the last two cycles. The previous cycles, however, got back to the -54% level soon enough, but they struggled hard to break above it, as the price had been stuck in a sideways trend for a long time at the level.
Both these cycles of the cryptocurrency approximately took six months from the current 842 days mark before they broke above the -54% mark and made further recovery. “This is perhaps an indication of the boredom which may lie ahead,” explains Glassnode.
Bitcoin has been stuck in consolidation for quite a while already now, as the volatility of the asset has dropped to historical lows. Many have been hoping to see the coin break away from this flat movement, but if the above-explained historical pattern is anything to go by, perhaps investors would be left waiting for a while yet.
BTC Price
At the time of writing, Bitcoin is trading around $29,400, up 2% in the last week.