Ethereum Network-Related Metrics Light Up, Optimistic Sign For August?
On-chain data shows that Ethereum network-related indicators have turned green, something that could be constructive for the asset this month.
Ethereum Active Addresses & Network Growth Have Registered A Rise
According to data from the on-chain analytics firm Santiment, ETH has closed the month of July seeing positive developments in its underlying metrics. There are mainly two indicators of relevance here: the daily active addresses and the network growth.
The former of these keeps track of the daily total amount of addresses on the Ethereum network that are coming online and taking part in some transaction activity. The latter, on the other hand, measures the total number of new addresses that are being created by users every day.
The daily active addresses can be considered analogous to the number of unique users, whether new or existing ones, that are making use of the blockchain, while the network growth specifically only contains information about the new users that are coming to the network.
Here is a chart that shows the trend in these two indicators for Ethereum over the last few months:
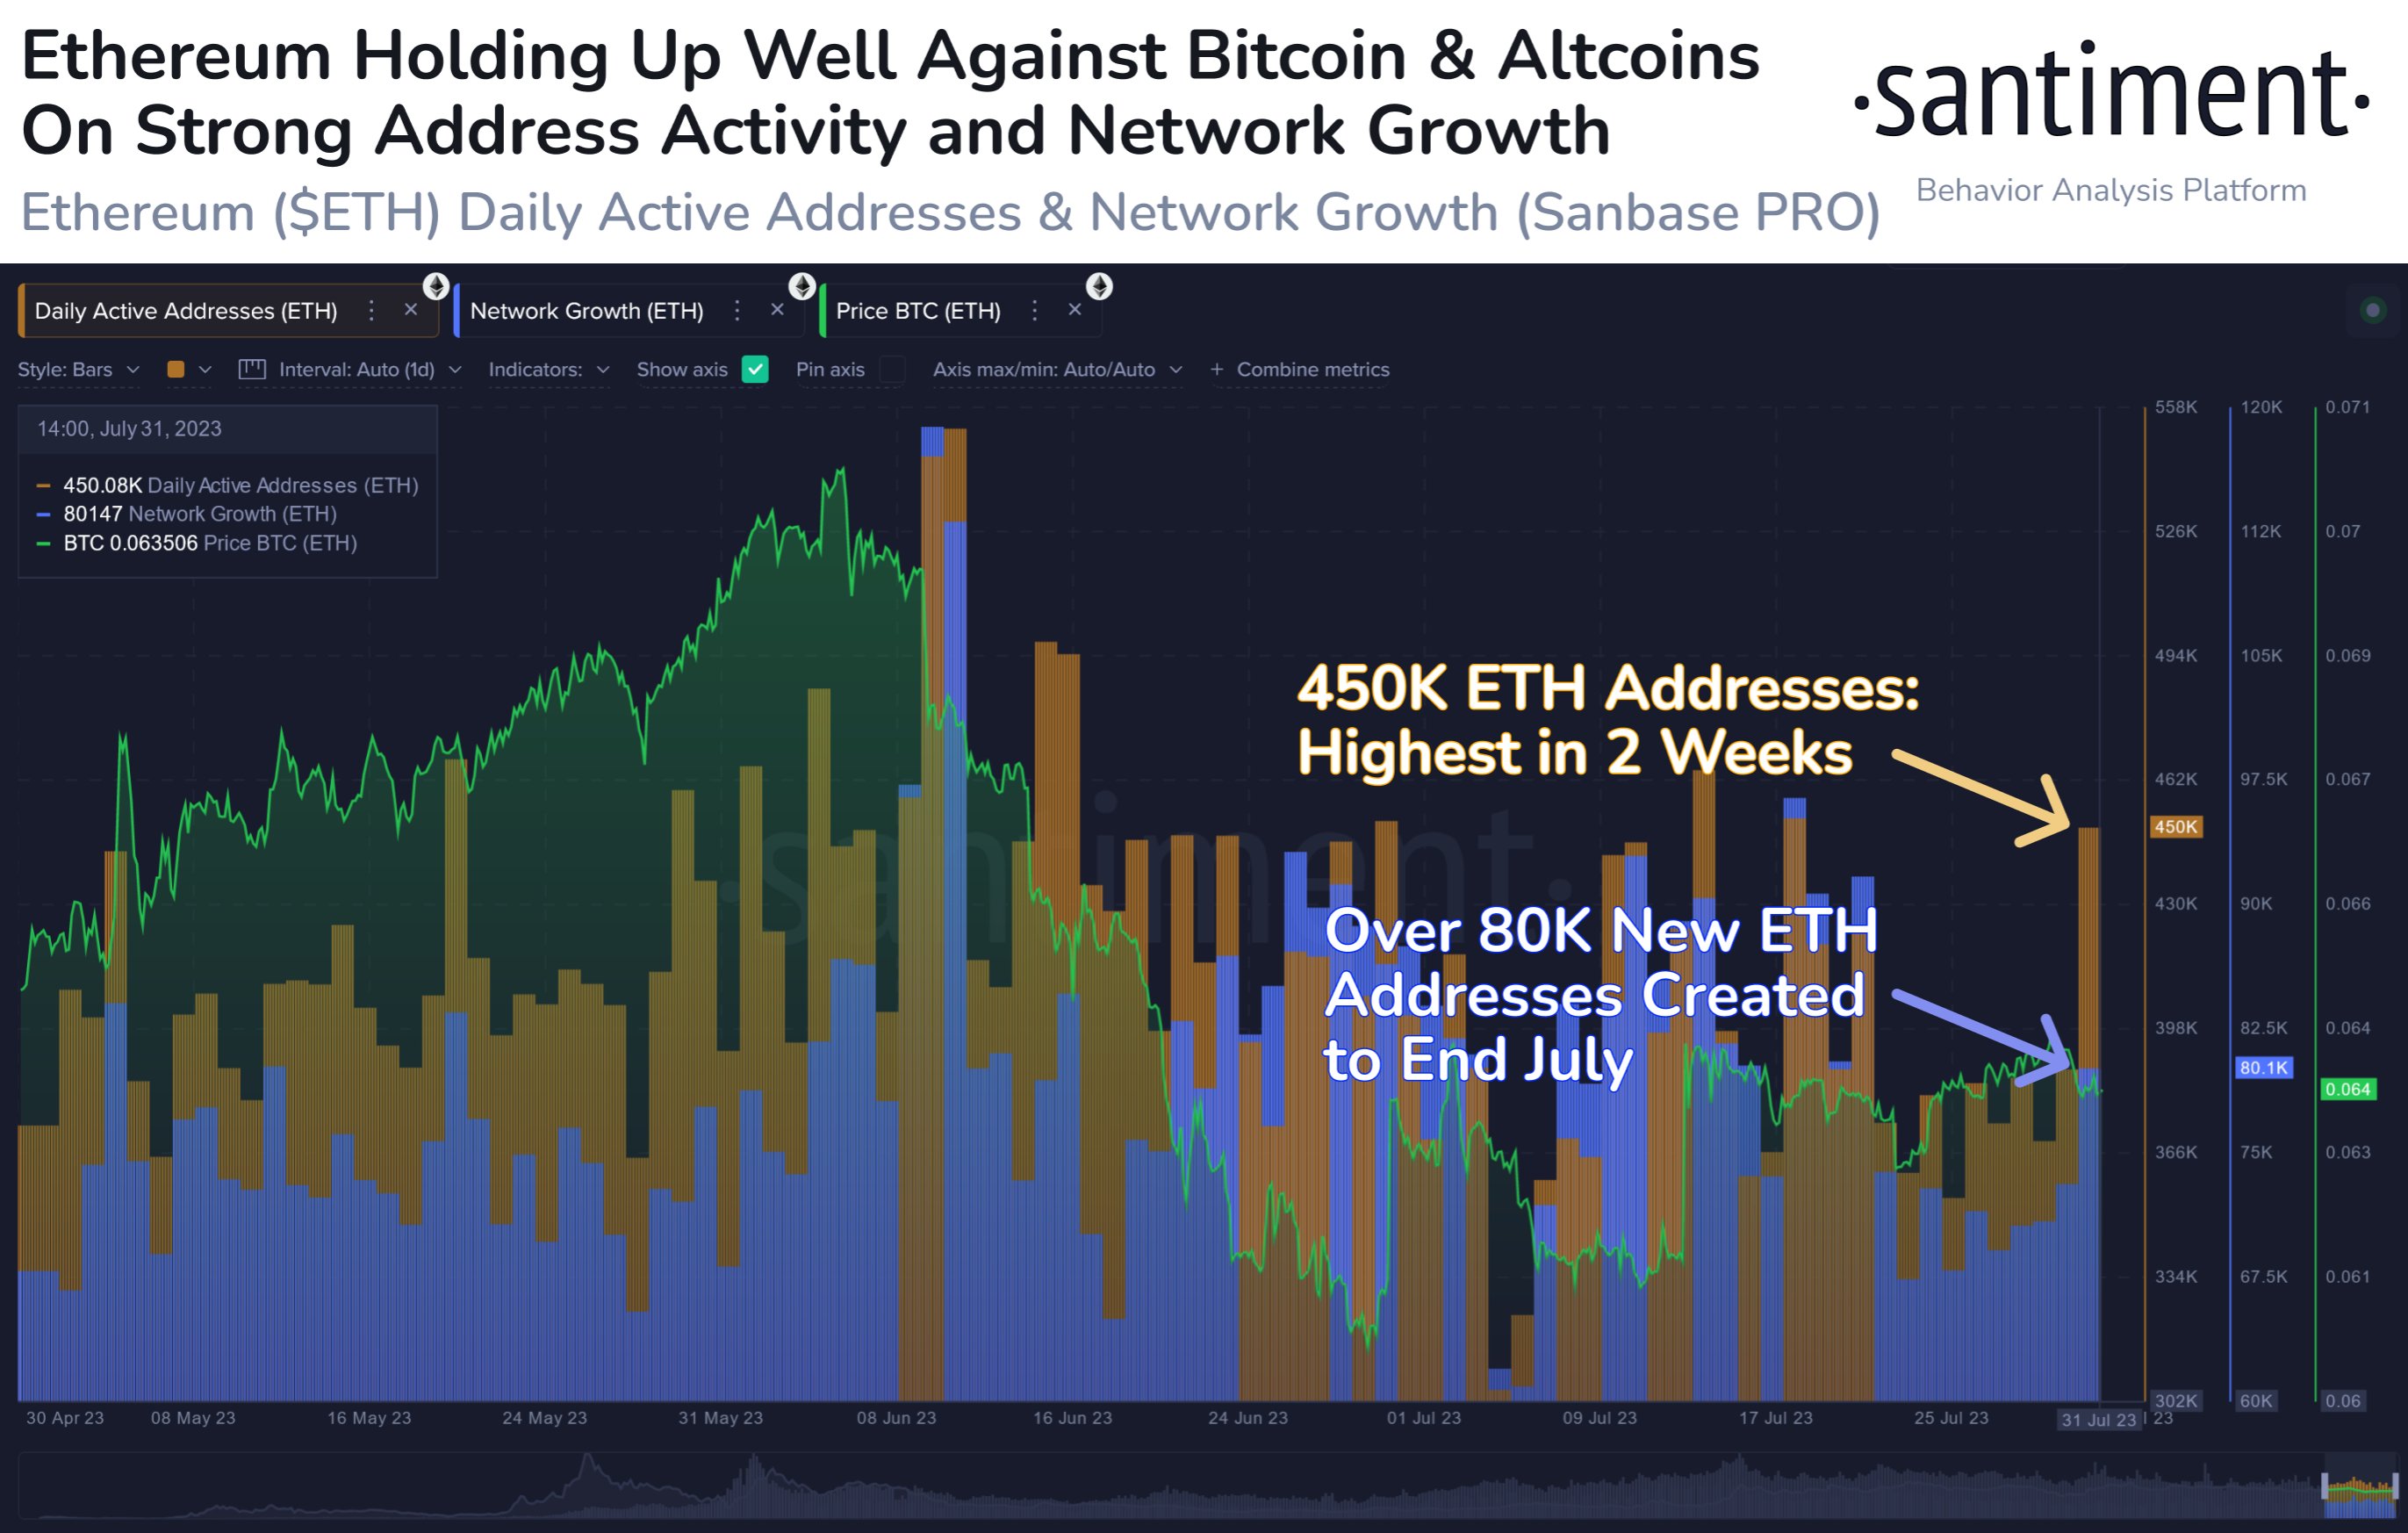
As displayed in the above graph, the Ethereum daily active addresses and the network growth, both, have registered an uptick to head into the month of August.
Currently, the former metric has a value of 450,000, which means that 450,000 addresses are participating in transaction activity on the ETH blockchain daily. This level is the highest that the indicator has been in around two weeks.
Generally, whenever the chain is witnessing a high number of active addresses, it’s a sign that a large amount of traders are interested in the cryptocurrency right now.
Since ETH is receiving a large amount of traffic at the moment, it’s possible that the price could soon register some volatility, although its direction could go either way.
New addresses on the network are also being created at a rate of more than 80,000 right now, suggesting that new users are constantly picking up the cryptocurrency.
Adoption is always a constructive sign for any coin, as any sustainable growth in the price is only possible when the user base is also observing sufficient growth.
In the chart, the data for the ETH vs BTC price is also shown. It would appear that back in May, Ethereum had been rallying against Bitcoin, and while this had been happening, both the active addresses and the network growth had been at values similar to now.
Ethereum could potentially display similar strength against the top-ranking assets in the coming month if the network can keep up this new trend of elevated user activity.
ETH Price
At the time of writing, Ethereum is trading around $1,800, down 1% in the last week.