A Bitcoin Correction Towards $55,000 Likely At The End of Week
Key Bitcoin Price Outlook
- Bitcoin reaches a short-term resistance trendline that constitutes a descending channel pattern.
- The cryptocurrency risks upside rejection heading into the weekend session.
- Its downside target lurks near $55,000.
Sliding US bond yields undermined the dollar and prompted bitcoin’s climb on Thursday. Nevertheless, the trade appeared cyclical as the cryptocurrency fell lower this Friday on signs of firmer yields and a rebounding dollar.
That said, the underlying bullish sentiment in the greenback kept a lid on Bitcoin’s ability to log a full-fledged breakout. Investors and traders have long anticipated that the cryptocurrency would log strong gains above $60,000. But — once again — it failed to follow up on its previous bullish leads, leaving the market at risk to log a downside correction instead.
Acting further as a bearish tailwind is a descending channel pattern visible on Bitcoin one-hour chart.
The cryptocurrency tested its upper trendline as resistance on Friday before it turned lower into the Asia-Pacific session. Now, the BTC/USD exchange rate tests its 20-hour exponential moving average as interim support. The recent history shows that it won’t hold the green wave (in the chart below) for far too long.
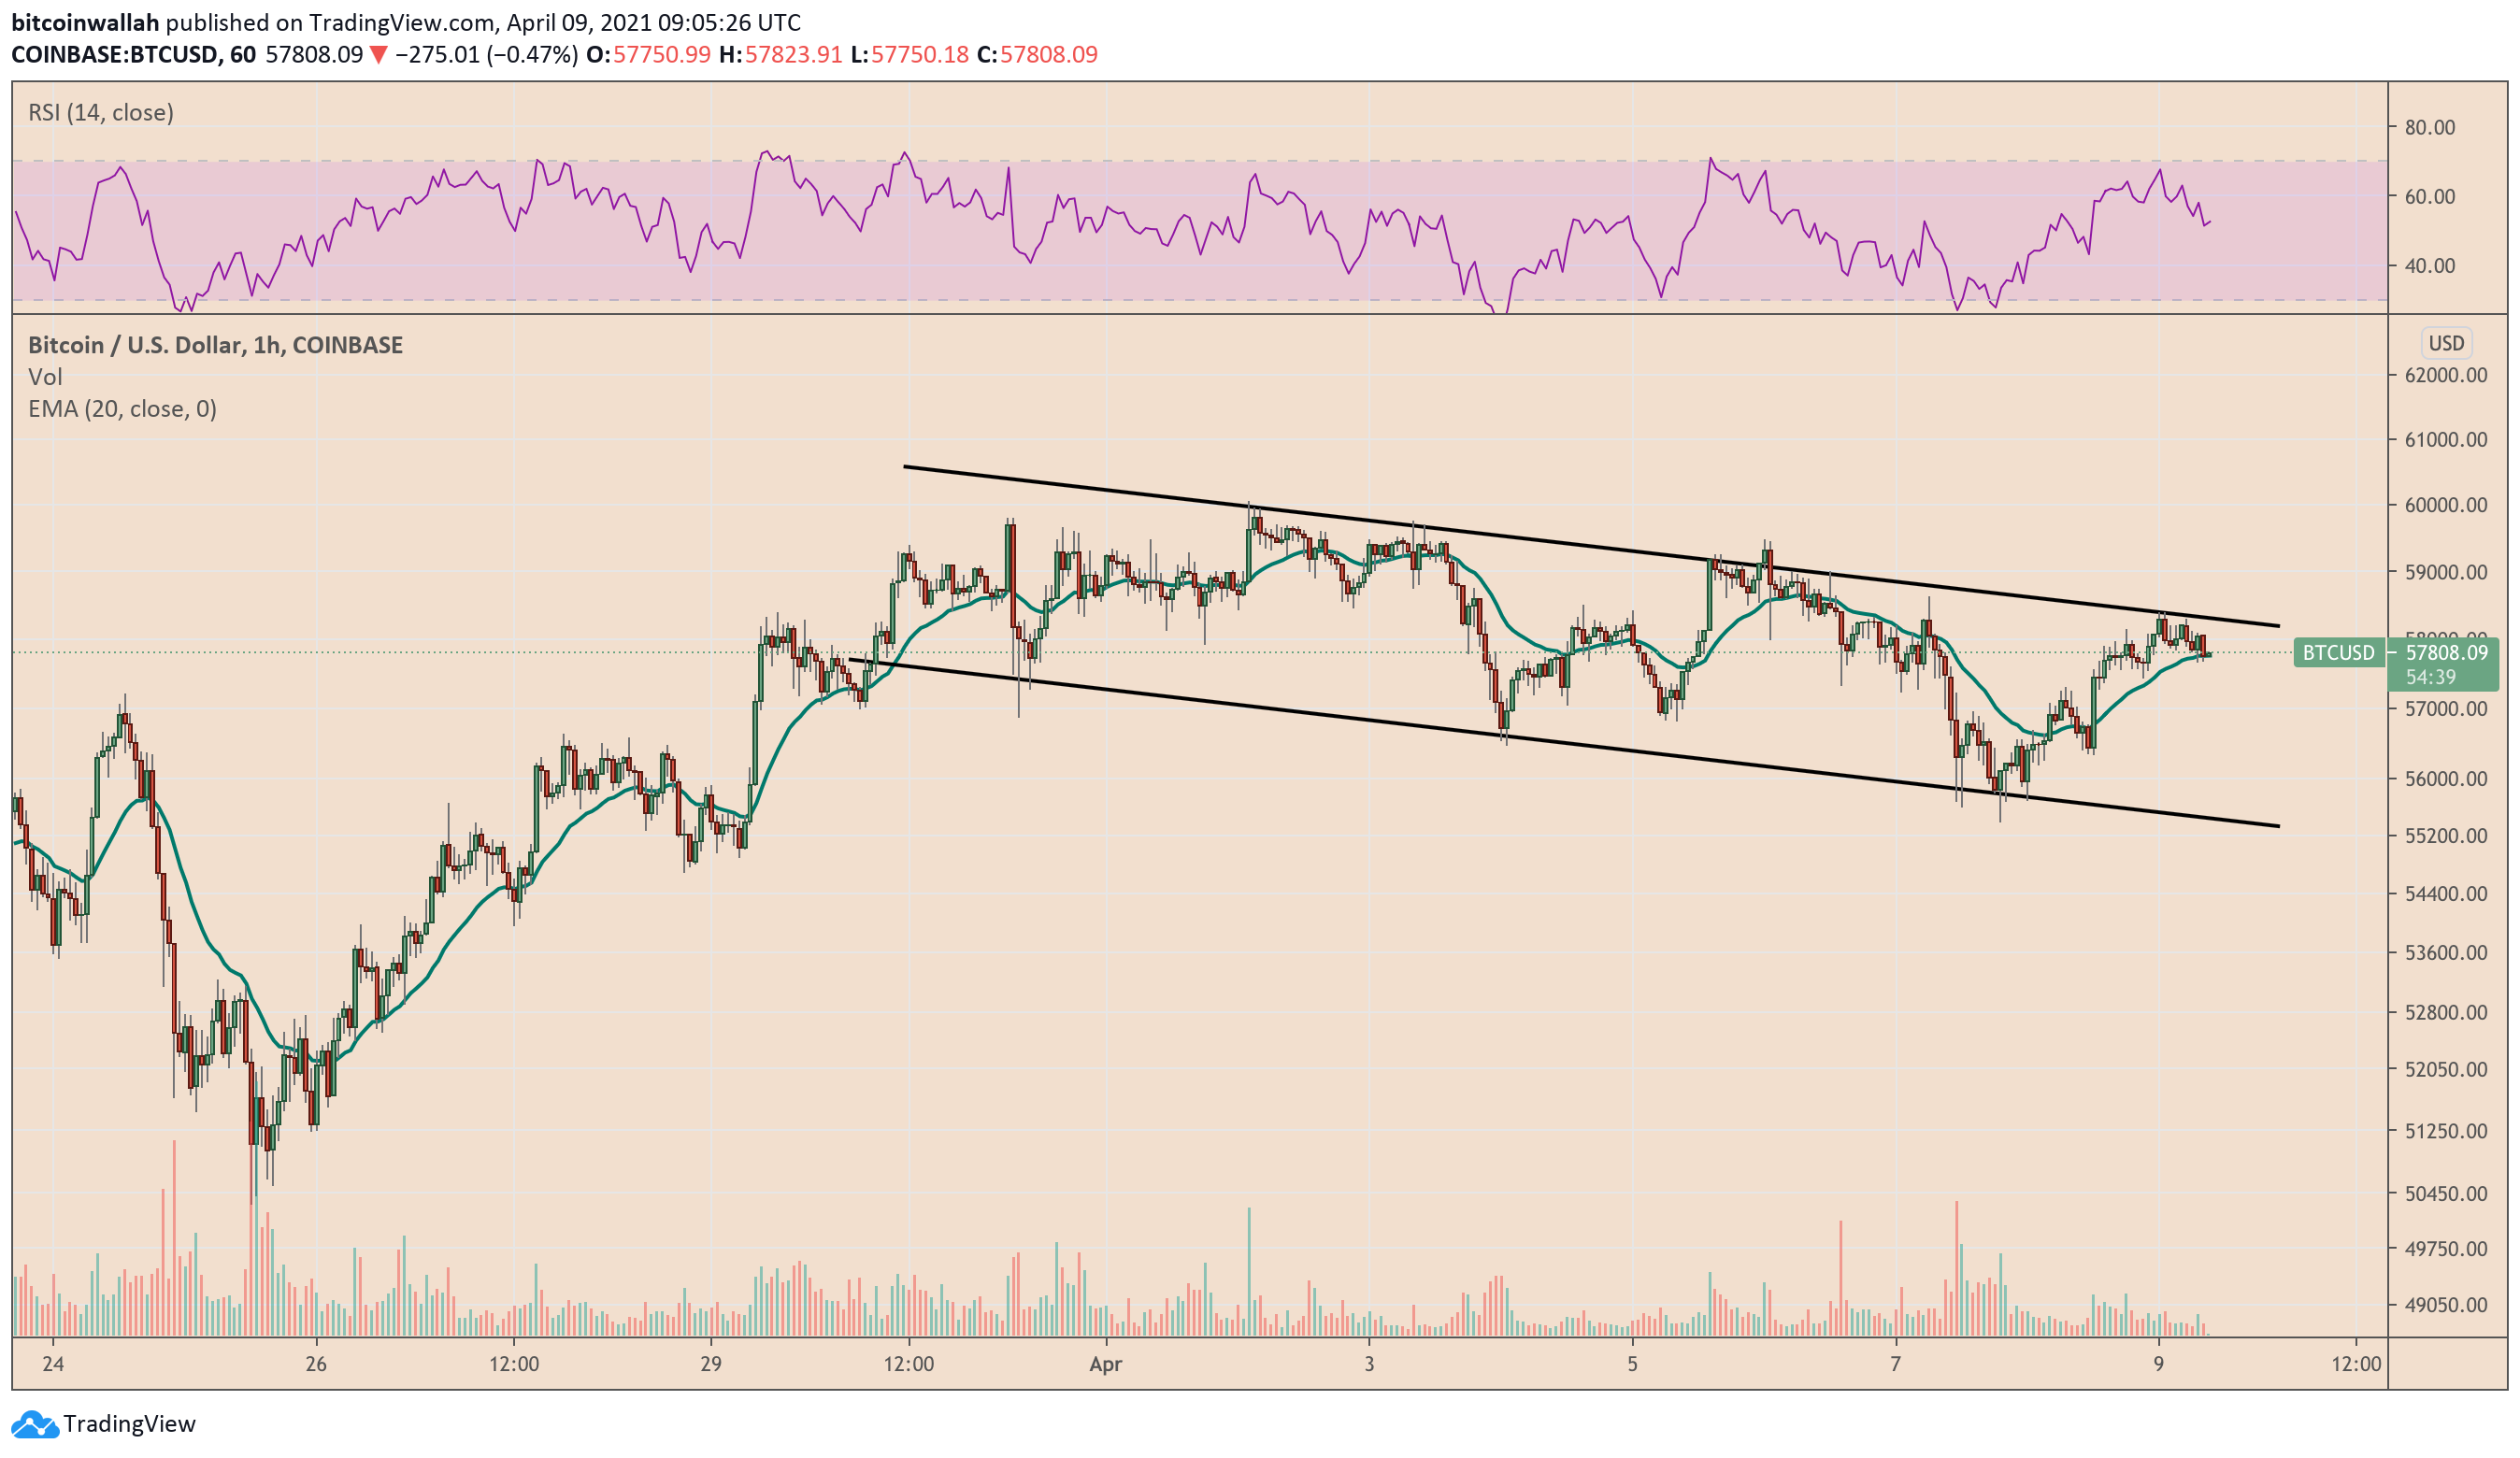
That said, breaking below 200-EMA would risk putting the Bitcoin price en route to the Descending Channel’s lower trendline. That support cluster sits around the $55,000 level.
Daily Chart
The path of least rejection for Bitcoin remains to the upside on longer timeframe charts.
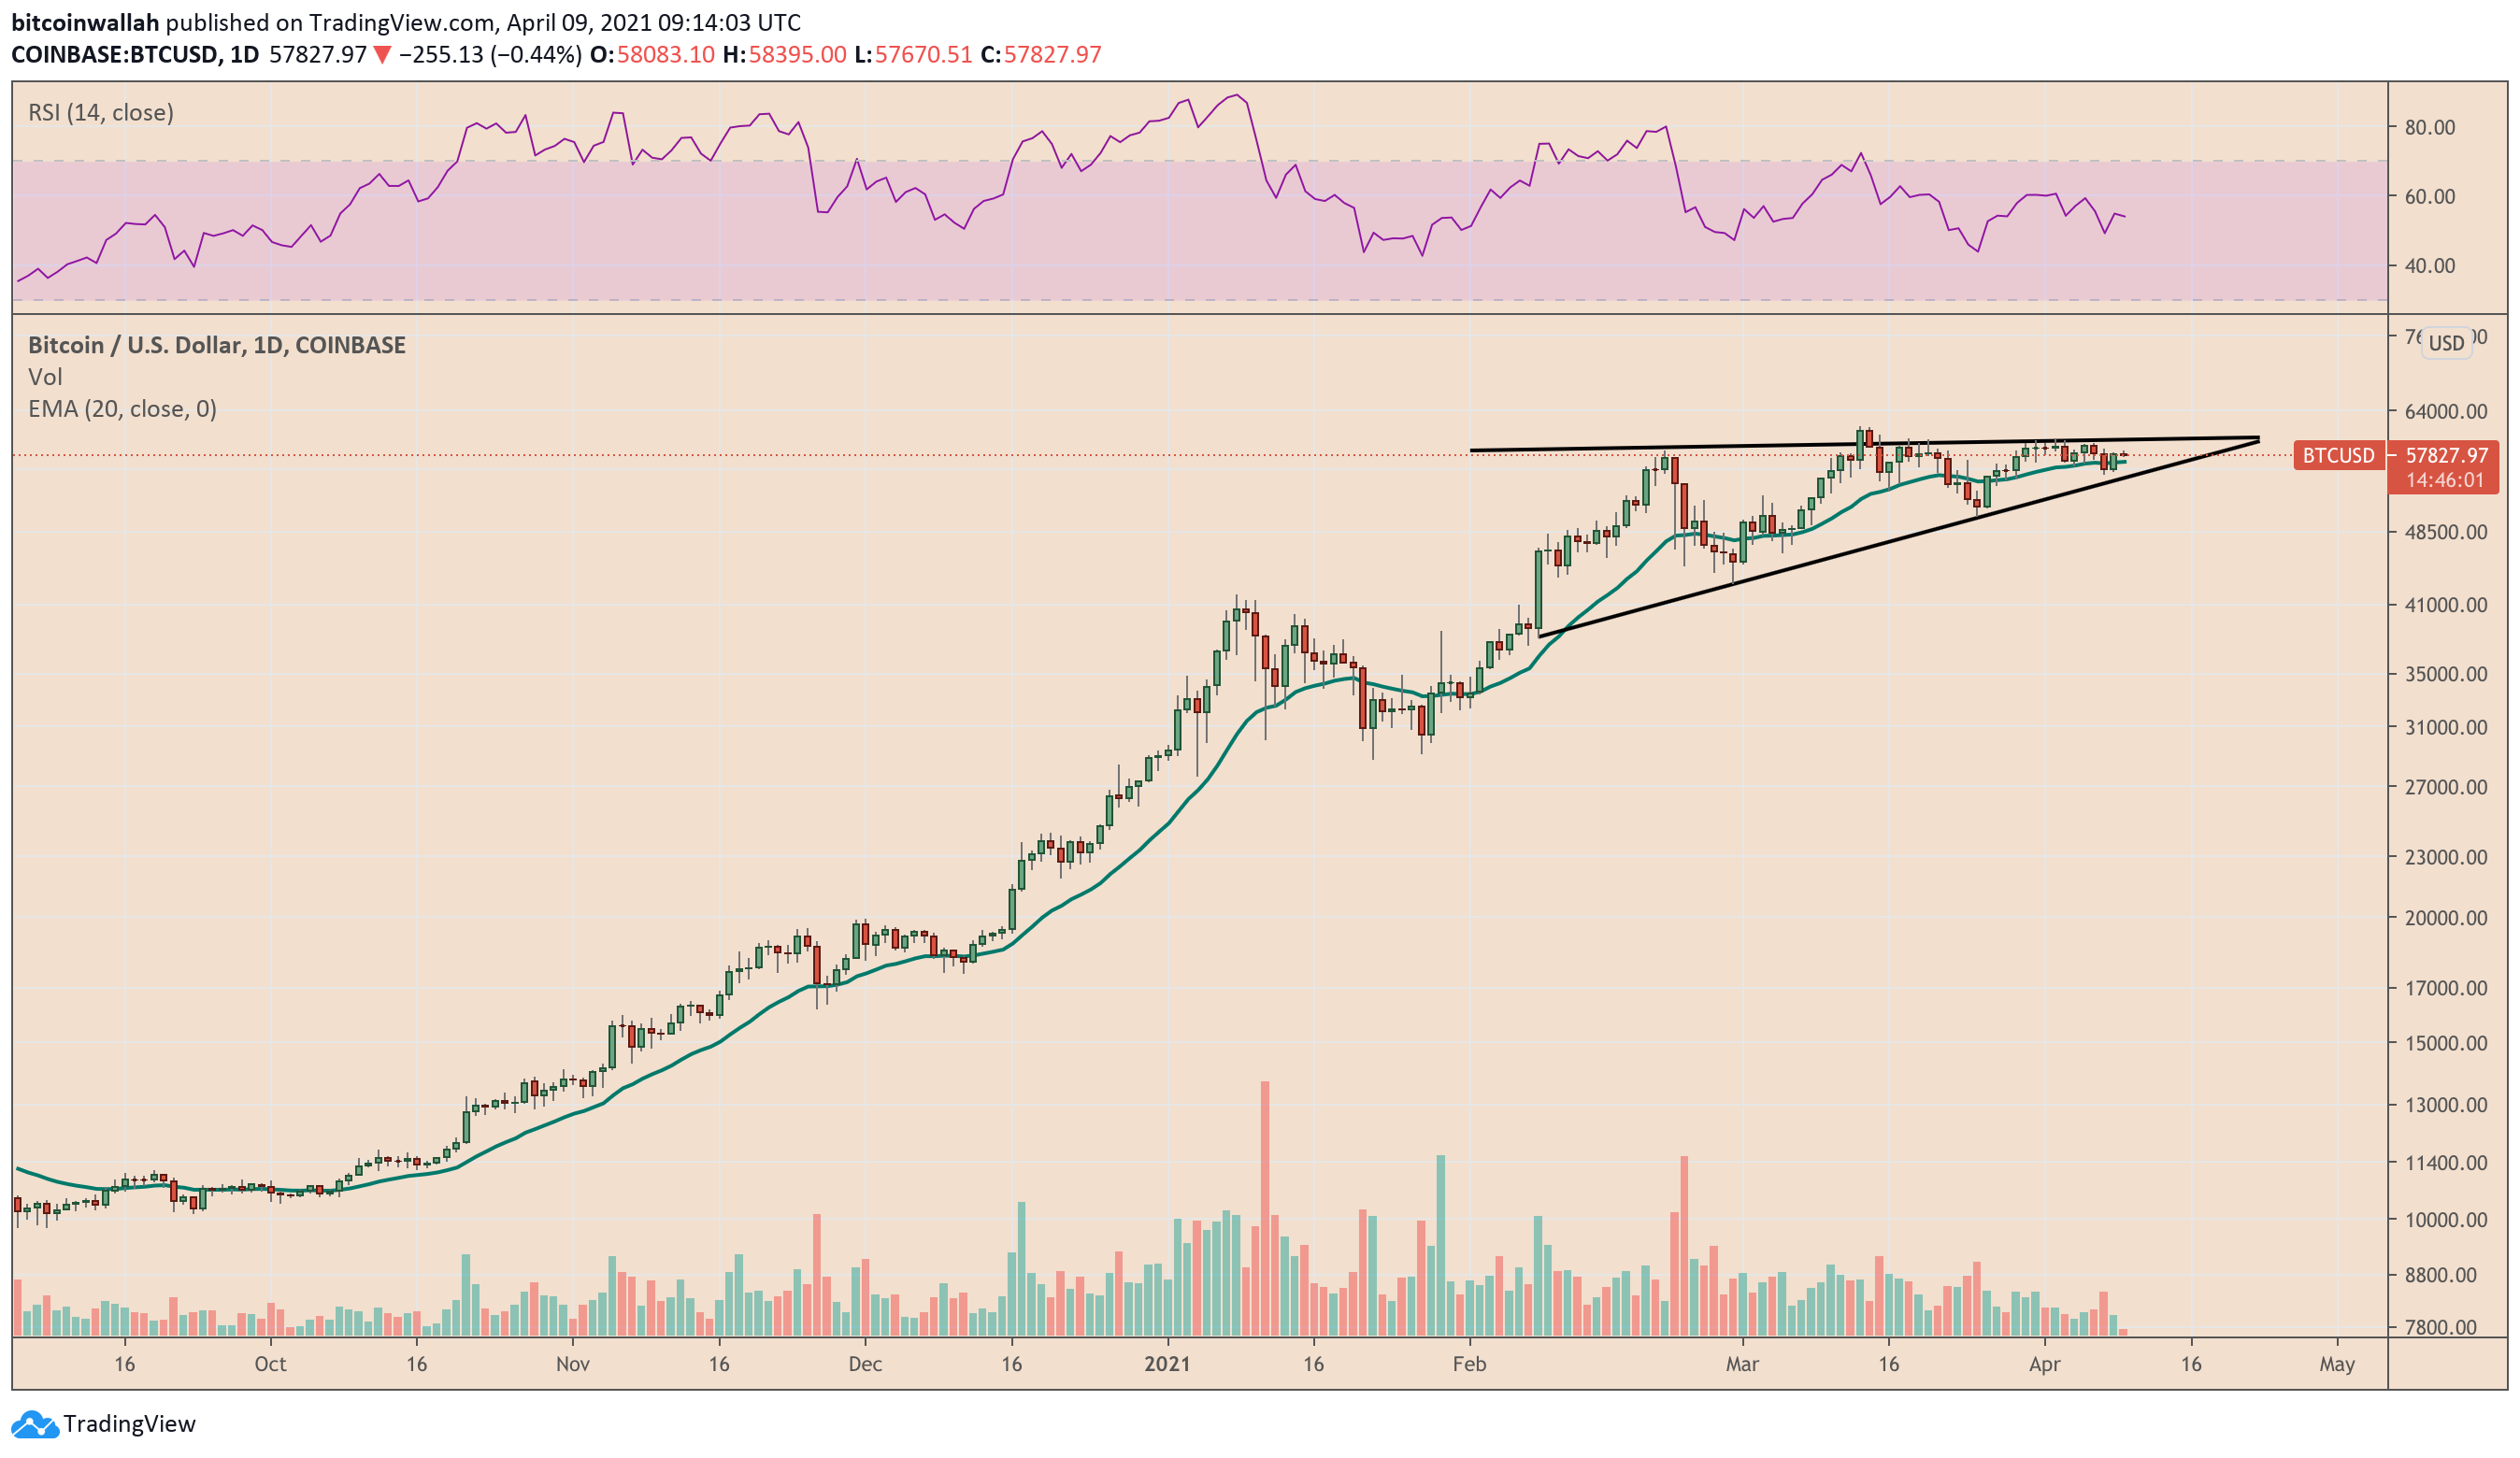
Bitcoin’s decline to $55,000 expects to meet strong downside rejection. Source: BTCUSD on TradingView.com
The BTC/USD exchange rate at or below $55,000 expects to attract accumulators, given the level constitutes a rising trendline that comes as a part of an Ascending Triangle. In retrospect, ascending triangles are bullish continuation patterns that appear when an asset fluctuates between a horizontal upper trendline and a rising upward trendline following an uptrend.
Technical chartists believe that almost 79 percent of the time, ascending triangles lead to an upside price breakout. The price breaks above the horizontal resistance and pursues a technical target as high as the Triangle’s maximum height. That puts the bitcoin price en route to hitting $70,000 in the medium-term, with a sight towards $75,000.
Fundamentals agree. The Federal Reserve has committed to keeping interest rates near-zero until it achieves its targets of maximum employment and inflation above 2 percent. The central bank’s loose monetary policy expects to stay intact until 2024, pressuring the US dollar lower and safe-havens like Bitcoin higher.
Photo by Ussama Azam on Unsplash