Bitcoin Bull Flag Suggests Price Will Explode Beyond $70,000
A classic technical indicator suggests that Bitcoin, the world’s leading cryptocurrency by market cap, would become more valuable than it already is.
$70,000 Next?
Dubbed as Bull Flag, the chart pattern forms when an asset consolidates downwards for a brief period after undergoing a massive price surge. It looks like a downside-sloping channel, denoted by two parallel trendlines, in which the price fluctuates. During this period of consolidation, the volume declines.
Bitcoin is forming or at least hinting to form a similar downside channel.
The cryptocurrency checks almost all the requirements that suggest it is in a bull flag pattern. First, its preceding trend is upward. Second, it is trading in the area defined by the Flag’s two parallel trendlines. And third, its net bearish retracement compared from the Flag top is shy of 19 percent (a pullback of more than 50 percent tends to invalidate the flag theory altogether).
Ideally, the retracement expires after the price corrects by 38 percent from the sessional top.

Traders typically look to enter a long position on a breakout above the high of the Flag’s upper trendline. Their upside target sits at length potentially equal to the size of the uptrend before the Flag formation. The so-called “flagpole” height comes to be $15,469.
Measuring from the point of breakout — roughly near $56,000 — the flag’s upside target sits near $71,469 (~$71,500).
Bitcoin Bearish Case
Not confirmed, Bitcoin also risks forming a bearish technical structure should it reject a breakout move above $58,500.
In retrospect, the $58,500-level capped the cryptocurrency from breaking upward during the late February session. On bitcoin’s next attempt, the price surpassed $58,500 to form a record high at $61,778 (data from Coinbase). Nevertheless, the cryptocurrency flipped $58,500 all over again as resistance following its 19 percent correction.
And now, bitcoin is testing $58,500 to the upside all over again. That constitutes a potential head and shoulder indication, which is a bearish reversal pattern.
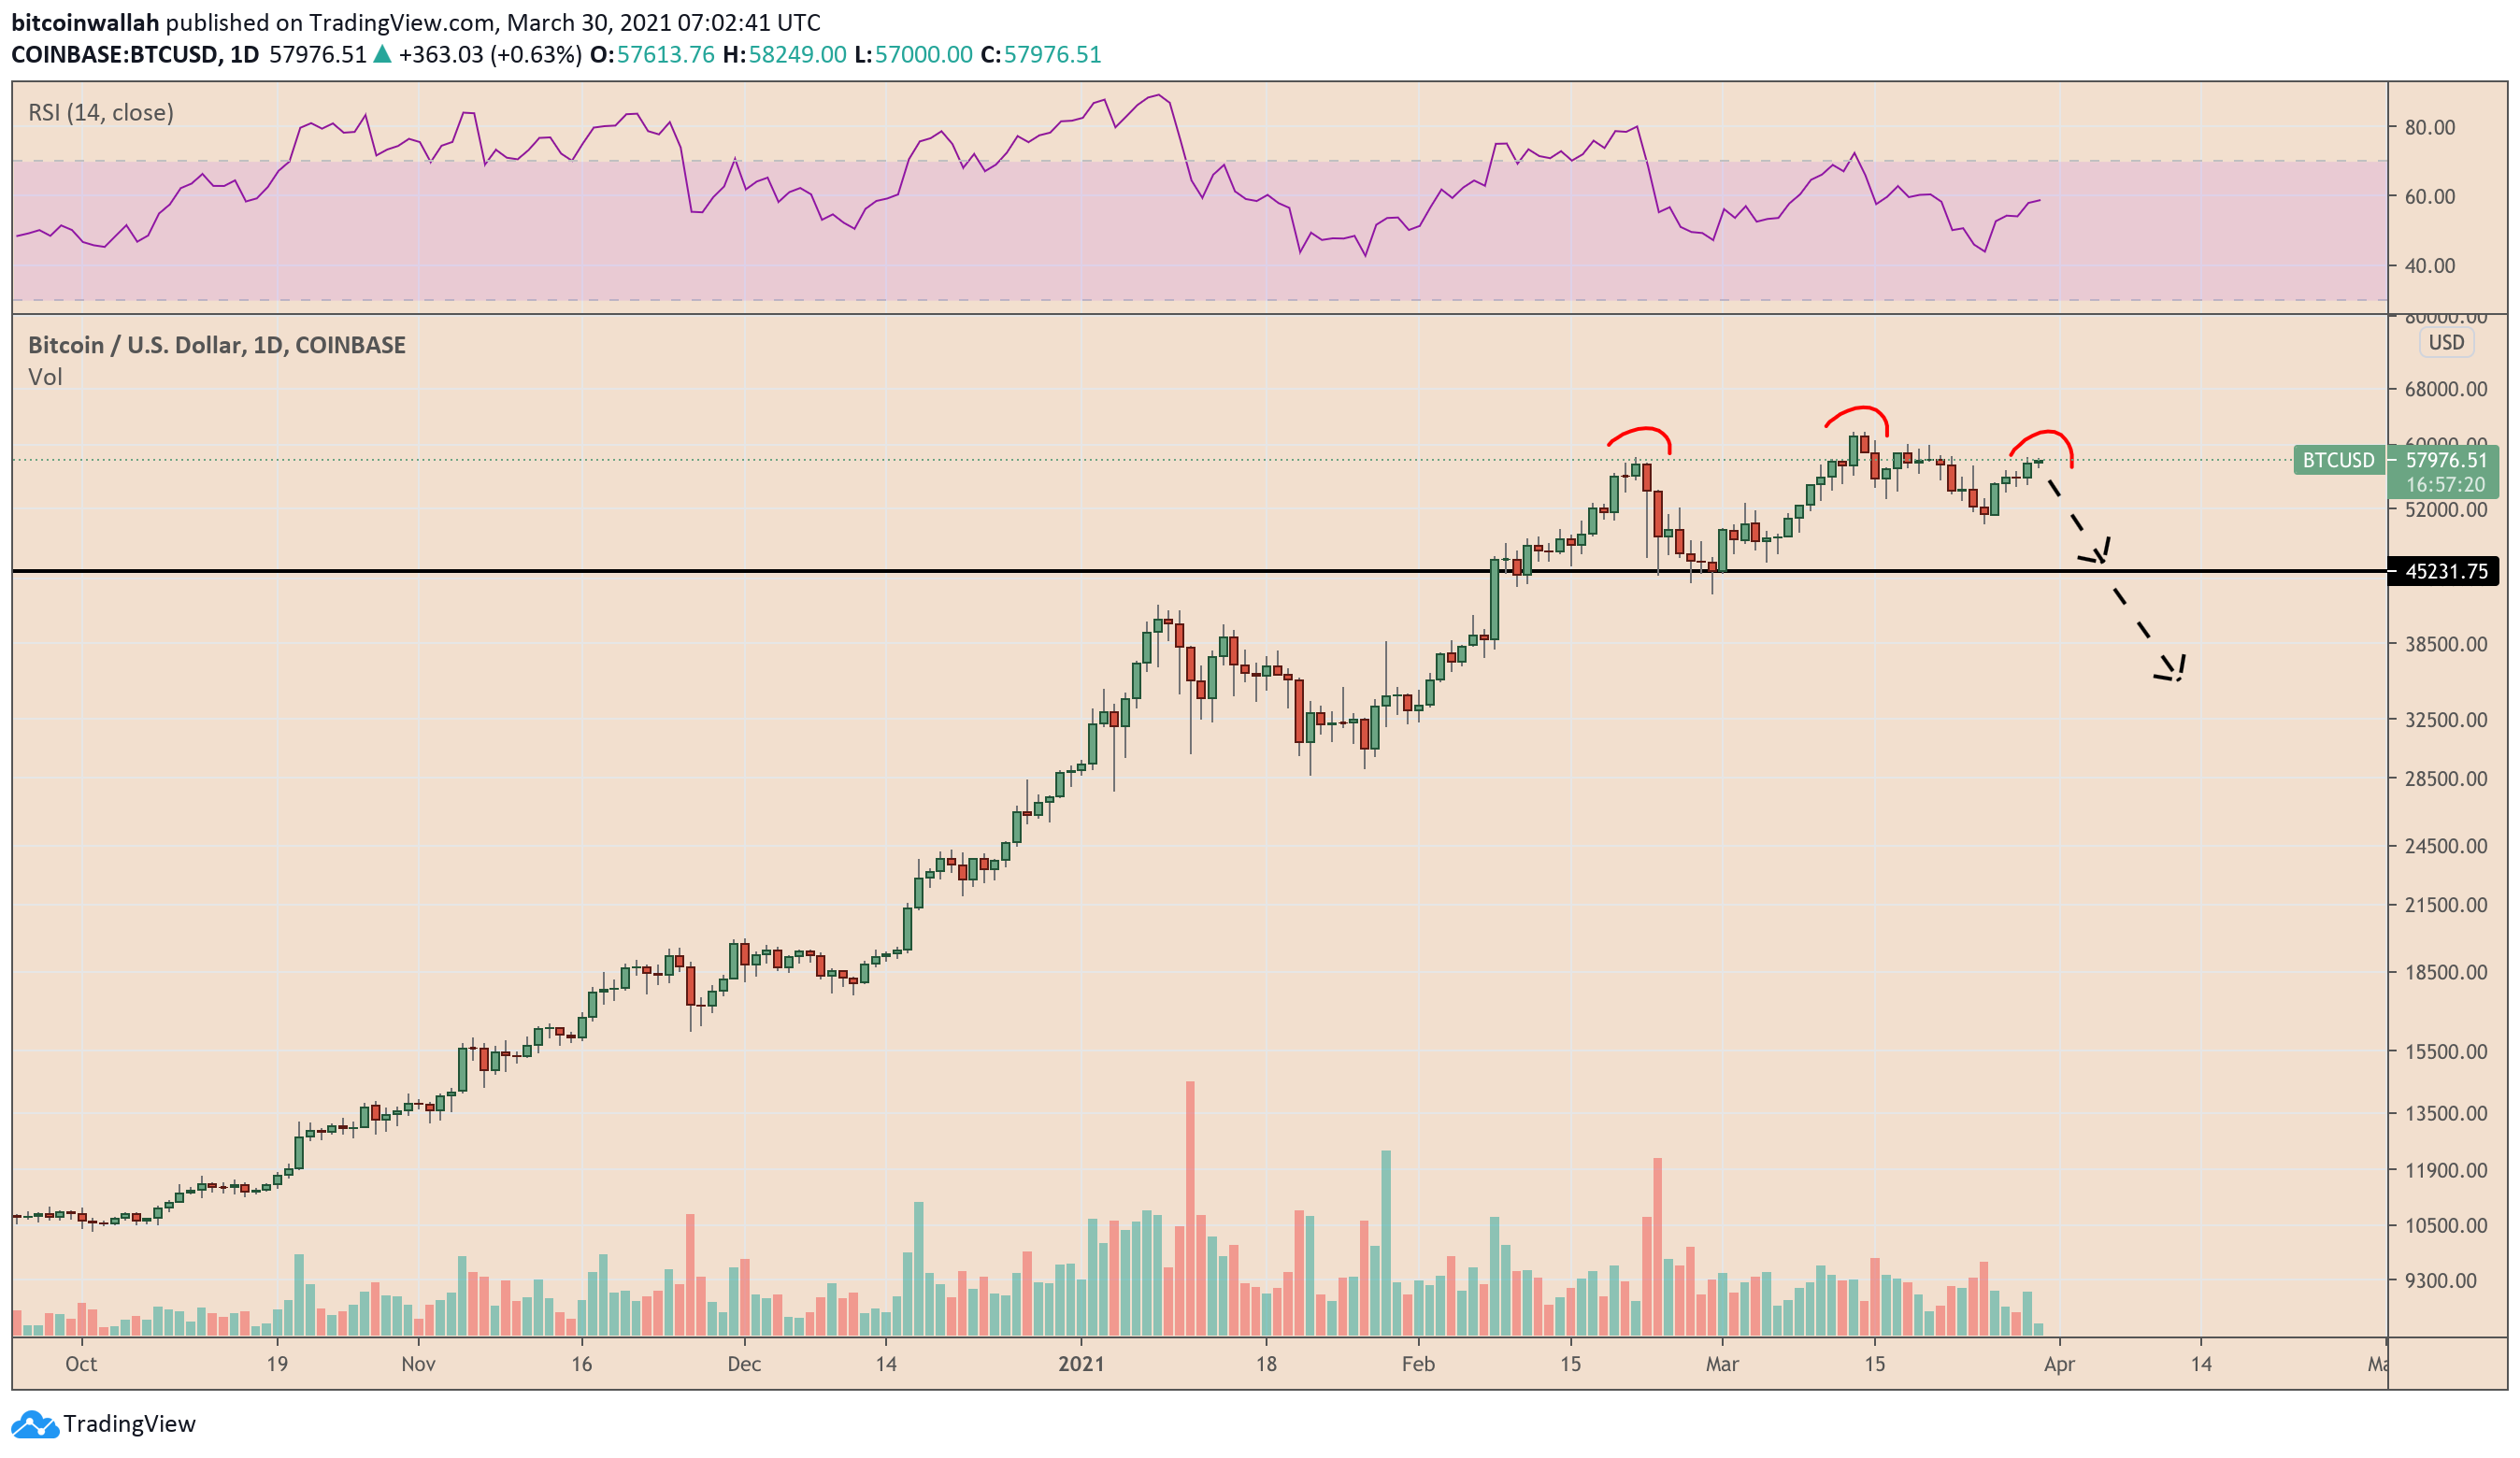
A breakout from the head and shoulder risks crashing Bitcoin by as much as the height of the pattern’s neckline support and its top. It comes to be $16,339, which shifts the cryptocurrency’s downside target near $30,000.